Income is a collection of views that focus on projected income sources based on account withdrawals, other income, and RMDs. Each view has a chart and table view that can be switched between using the toggle in the upper right hand corner of the view panel.
You can isolate specific items on the chart by click on their name in the legend. Please note that this will not exclude them from the plan, just temporarily hide them from view in the chart.
All ages shown in table views are as of year-end.
By Source (Gross)
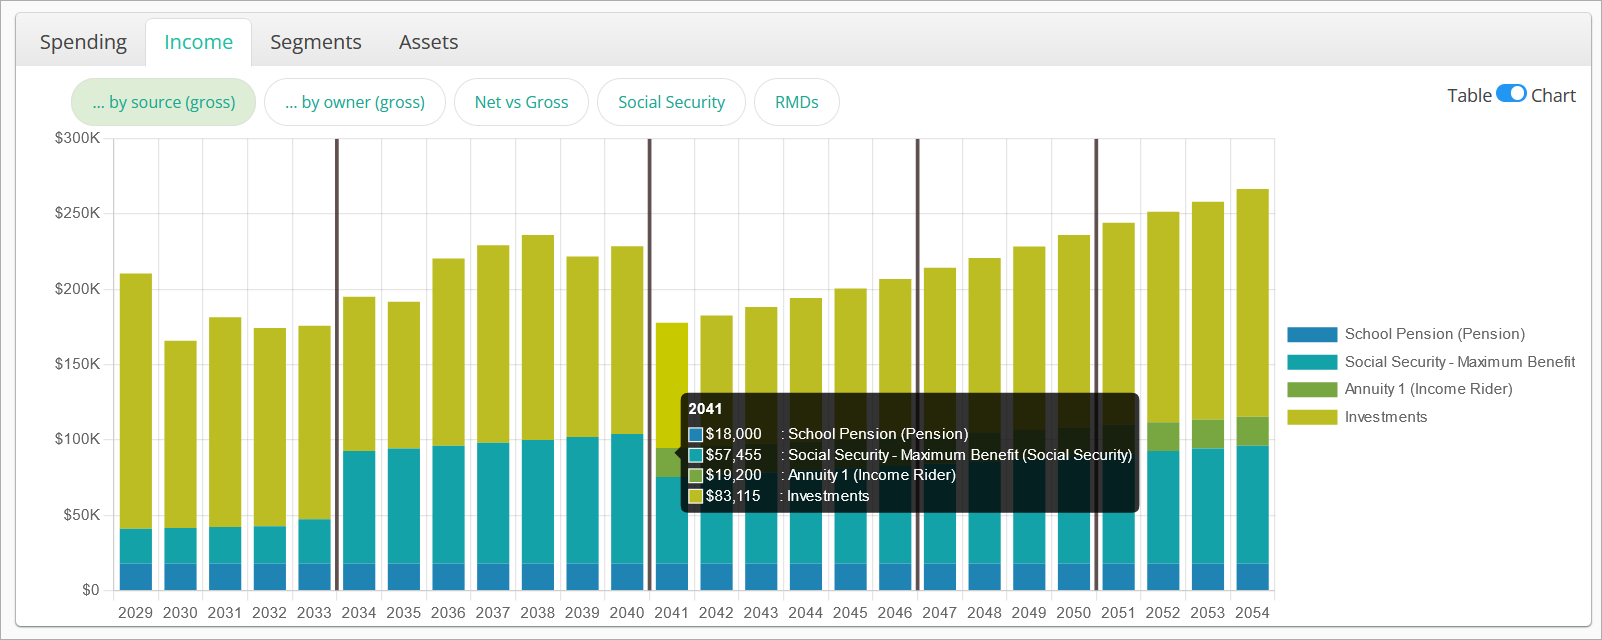
Income by Source (Gross) shows items for:
- Each Other Income source
- Each annuity income stream
- Distributions from non-segmented accounts
- Combined Social Security benefit for both clients
- Combined account withdrawals (“Investments”)
All income shown in this view is pre-tax (“gross”).
Hovering over a column will show the total projected amount for each type of income over the year. The table view shows all projected amounts for all income sources in all years, including totals.
By Owner (Gross)

Income by Owner (Gross) is a roll-up view that shows items for each client as well as Joint. Ownership is derived from the chosen owner of the account from which a withdrawal is taken, and the assigned owner of Other Income or annuity rider income streams.
All income shown in this view is pre-tax (“gross”).
Hovering over a column will show the total projected income amount for each owner over the year. The table view shows all projected amounts for each owner in all years, including totals.
Net vs Gross
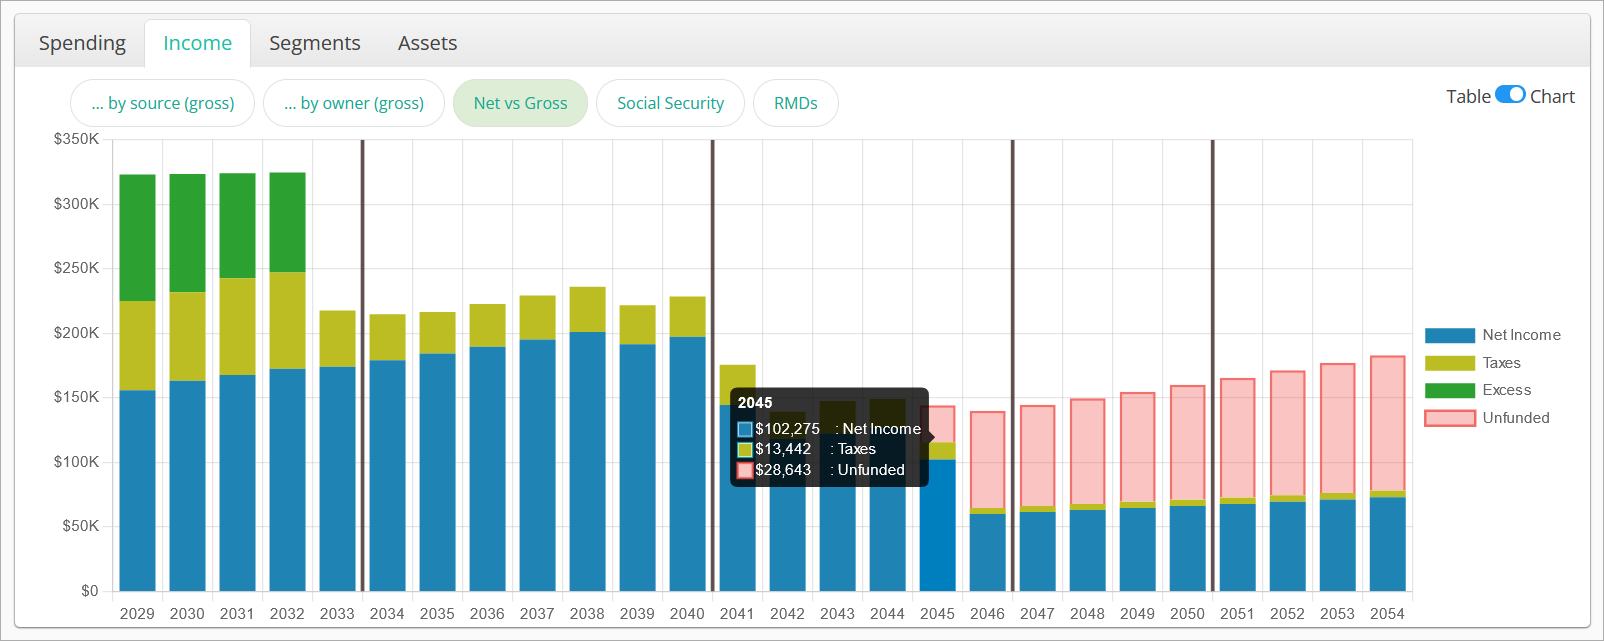
Net vs Gross is a roll-up view that shows:
- Net Income
- Taxes
- Excess
- Unfunded
Net Income is a sum of all after-tax income from account withdrawals, other income sources, and annuity income riders.
Taxes is a sum of all taxes, surcharges, and penalties.
Excess is the value of any after tax income incurred that exceeds the income need (expenses, RMDs, taxes) for the year. Excess can be treated as spent, or reinvested into a Sweep account.
Unfunded is the value of any expenses that cannot be met during the year due to a lack of income sources and investment assets. Unfunded income indicates that a plan is not viable in its current state.
Hovering over a column will show the total projected value for each item over the year. The table view shows all projected amounts for each item in all years, including totals.
Social Security

Social Security shows the projected pre-tax (gross) benefits for each client. Claiming strategies can be adjusted in the Social Security input tab.
Hovering over a column will show the total projected benefits for each client over the year. The table view shows all projected benefits for each owner in all years, including totals.
RMDs
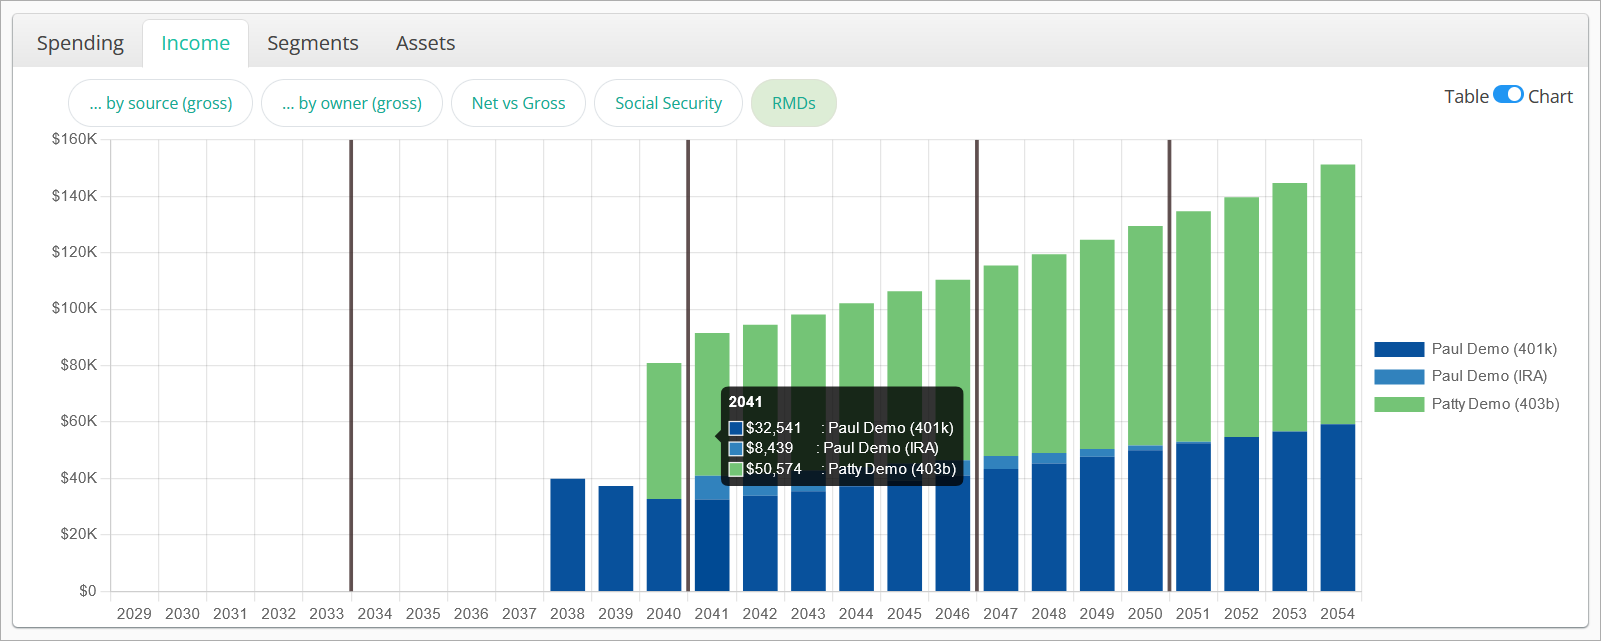
RMDs shows the projected Required Minimum Distributions for each account type by client.
Hovering over a column will show the total projected RMD for each client over the year. The table view shows all projected RMDs for each owner in all years, including totals.
The RMDs view is also available under the Assets tab.
Marginal Rates (Taxable Ordinary)

Marginal Rates (Taxable Ordinary) illustrates the total taxable ordinary income each year for both pre-plan and in-plan periods, broken down by whether it is attributable to Roth conversions, RMDs, or any other type of taxable ordinary income. Any pre-tax contributions to qualified accounts as well as the standard deduction have already been applied.
Marginal ordinary income tax rate thresholds are illustrated in lines that overlay the chart. This view gives insight into whether income is entering a higher tax bracket each year and whether this outcome is a result of Roth conversions and/or RMDs.
The rate at which the marginal thresholds increase over time is set by the Tax Bracket Inflation figure in the scenario Settings.
Upon the projected death of a client, the filing status automatically switches to Single filer and the new thresholds are reflected in each line.
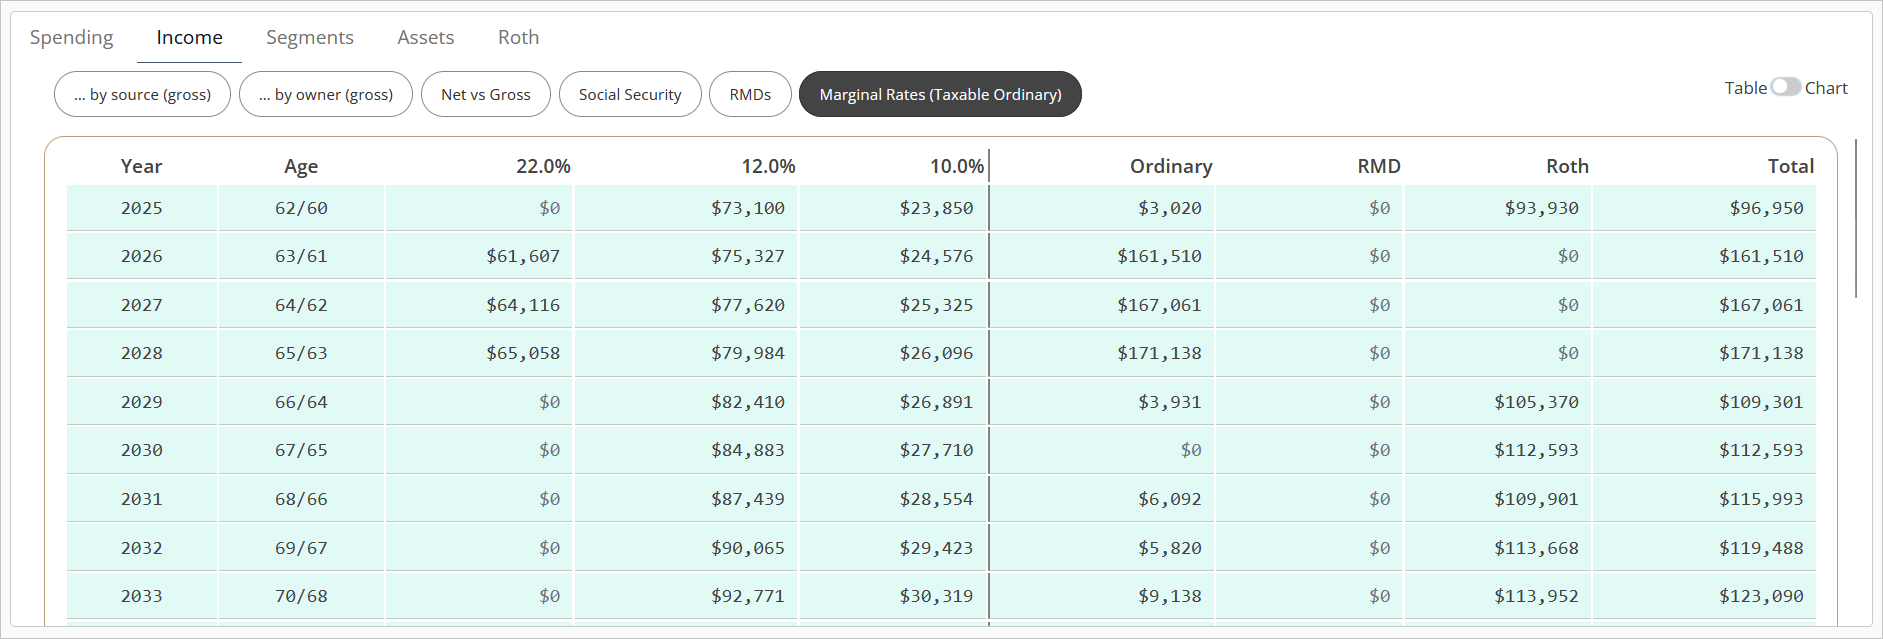
The table version of this view has two components. On the left half, ordinary income marginal tax rates are shown with the projected amount of income subject to that rate each year. This gives visibility into how far over the highest rate threshold the income falls in a specific year.
On the right half, the amount of ordinary income attributable to Roth conversions, RMDs, or any other type of taxable ordinary income is shown. The standard deduction is modeled as impacting “Ordinary” first. If the standard deduction reduces ordinary taxable income other than that from RMDs or Roth conversions to $0 in a year, then the remaining impact will be illustrated on the RMD amount. If taxable RMDs are reduced to $0, the impact will be illustrated on Roth conversions.
The Marginal Rates (Taxable Ordinary) view is also available under the Roth tab.
Jump to the next view: