Segments is a collection of views that focus on the allocation of plan assets across time segments. The Allocations view has a chart and table view that can be switched between using the toggle in the upper right hand corner of the view panel, whereas the Full Plan Detail view is table only.
You can isolate specific items on the Allocations chart by click on their name in the legend. Please note that this will not exclude them from the plan, just temporarily hide them from view in the chart.
All ages shown in table views are as of year-end.
Allocations
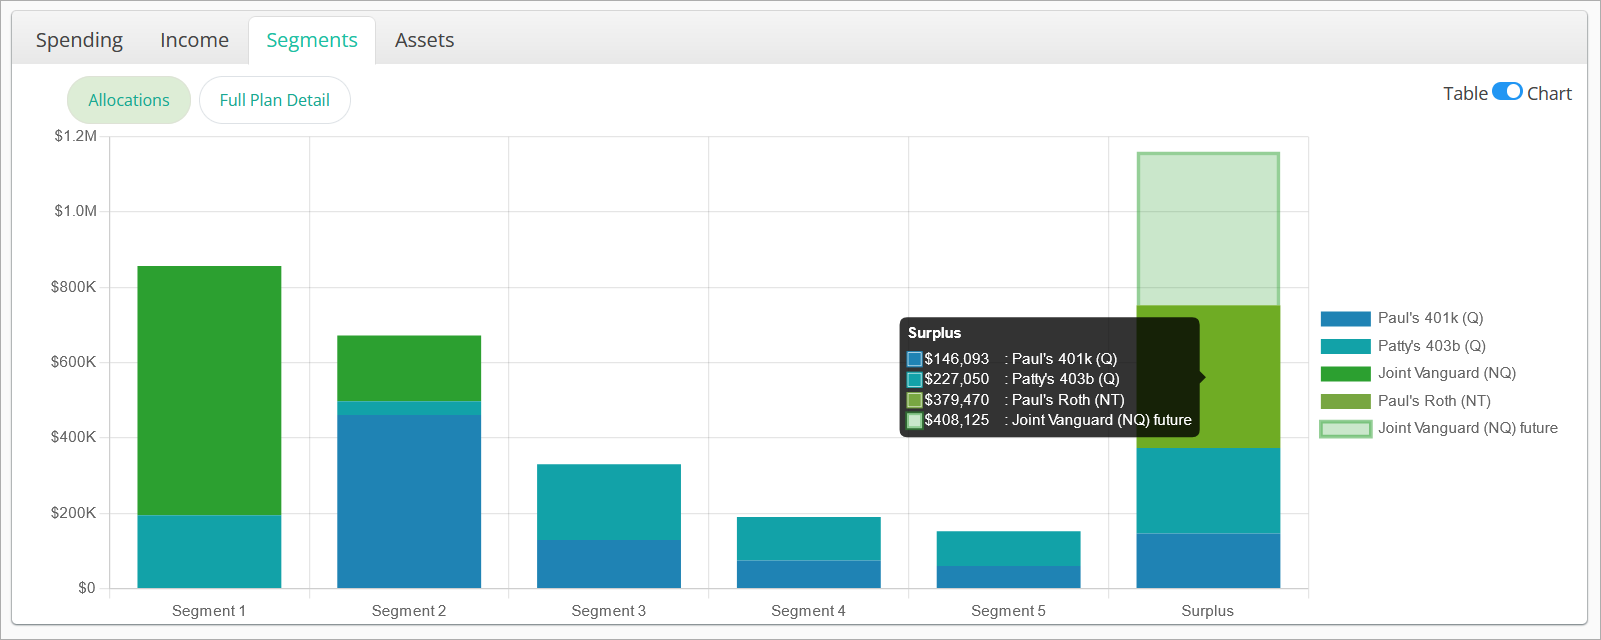
Allocations shows an individual item for each account used in the scenario by segment, as well as an item for each account that is projected to have inflows after the plan start date.
Inflows resulting in “future” items may be due to reinvestment of excess income into a Sweep account or Roth conversions scheduled to take place after plan start. These items as shown as semi-transparent in the chart and are labeled with a “future” suffix to differentiate them.
The Surplus segment is auto-generated when a scenario projects having more assets at plan start than are needed to commit to meeting income needs. Parameters for the Surplus segment can be set in the Segments controls tab.
Hovering over a segment column will show the asset value allocated to that segment by account. If a plan has significant unfunded income, one or more segments may be blank due to lack of assets.
Full Plan Detail

Full Plan Detail is a table-only view that shows consolidated information about income, taxes, and projected segment balances.
- Total Net Income: After-tax income from all sources for the year.
- Total Taxes: All tax types, surcharges, and penalties for the year.
- Other Income (Gross): All pre-tax (gross) Other Income, annuity income, and distributions from non-segmented accounts for the year.
- Withdrawals (Gross): All pre-tax (gross) withdrawals from accounts allocated to the segment currently in distribution.
Segment balances are shown as of end-of-year. Cells highlighted in green represent the years of the distribution phase for that segment.
The Non Segmented column represents the sum of all projected annuity cash values and other non-segmented account types at each year-end.
The Total column sums up both segmented and non-segmented balances.
The Total row at the end of the table sums up income and tax figures and also displays the ending balance totals for any remaining segmented and non-segmented assets. Excess income incurred in the final year of the plan and reinvested into a sweep account as well as any additional death benefits for annuities are captured in the total row values.
Jump to the next view: