Assets is a collection of views that focus on a variety of values related to accounts. Each view has a chart and table view that can be switched between using the toggle in the upper right hand corner of the view panel.
You can isolate specific items on the chart by click on their name in the legend. Please note that this will not exclude them from the plan, just temporarily hide them from view in the chart.
All ages shown in table views are as of year-end.
Withdrawals
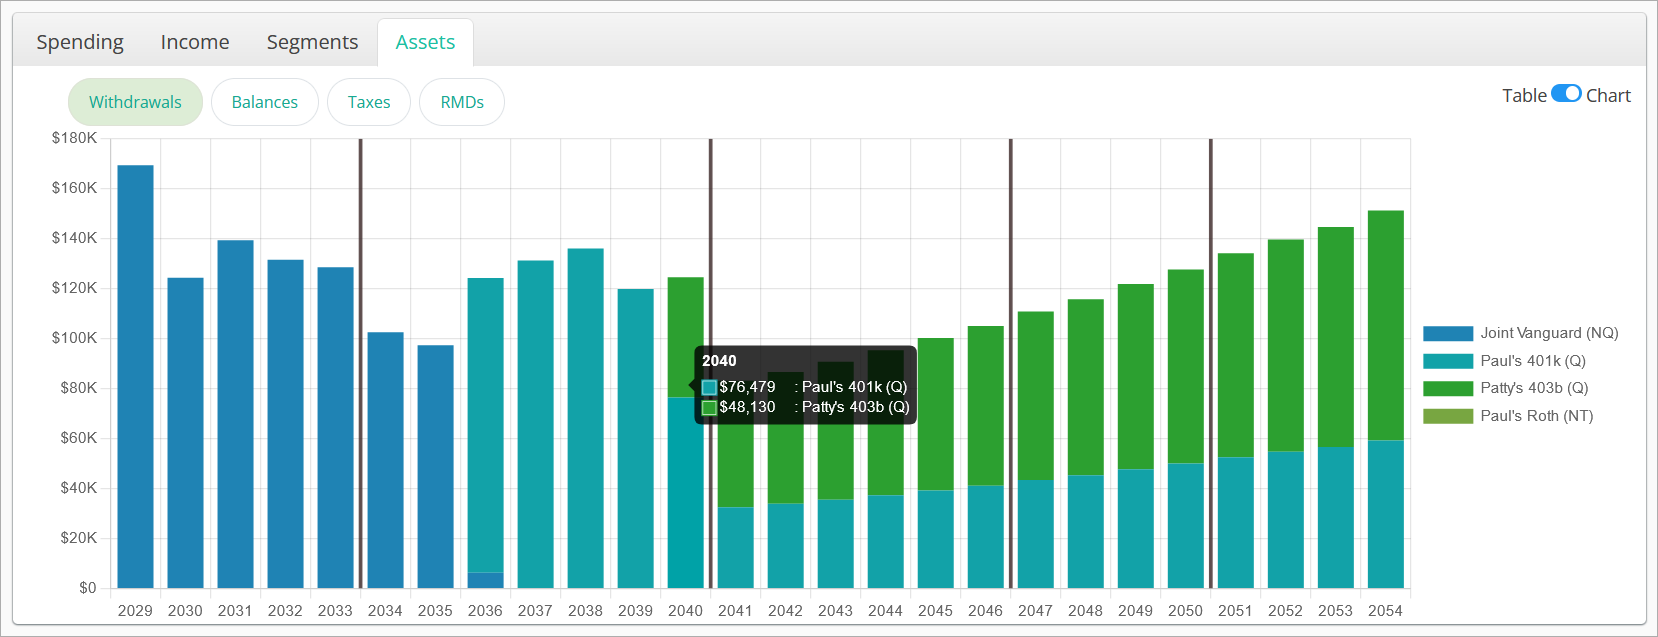
Withdrawals shows an item for each account being withdrawn from during the course of the scenario. Withdrawals can be a result of an account coming up for distribution in the liquidation order or RMDs.
Hovering over a column will show the pre-tax (gross) asset value projected for withdrawal from each account in that year. If a plan has other income sources that fully satisfy the expenses and associated taxes or significant unfunded income, some years in this chart may be blank.
Rider income from annuities is not shown in this view as they are considered as part of Other Income vs. a withdrawal from an investment account.
Balances
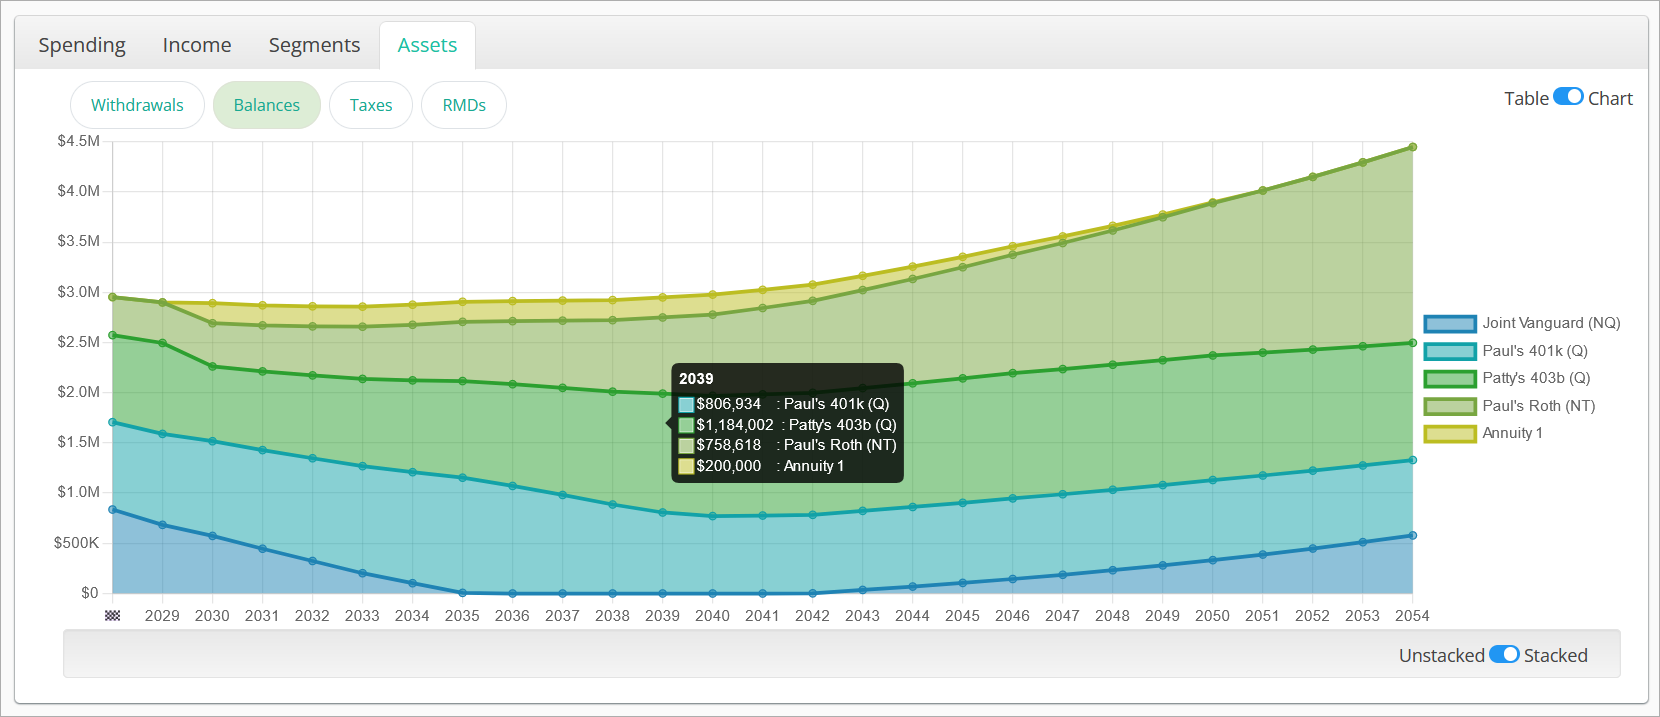
Balances shows the annual projected values of each account included in the scenario, as well as the projected cash value of any annuities modeled.
Hovering over a dot in the line chart will show the projected account asset value and annuity cash values in that year. If a plan has unfunded income, some years in this chart will likely show a $0 balance for all accounts.
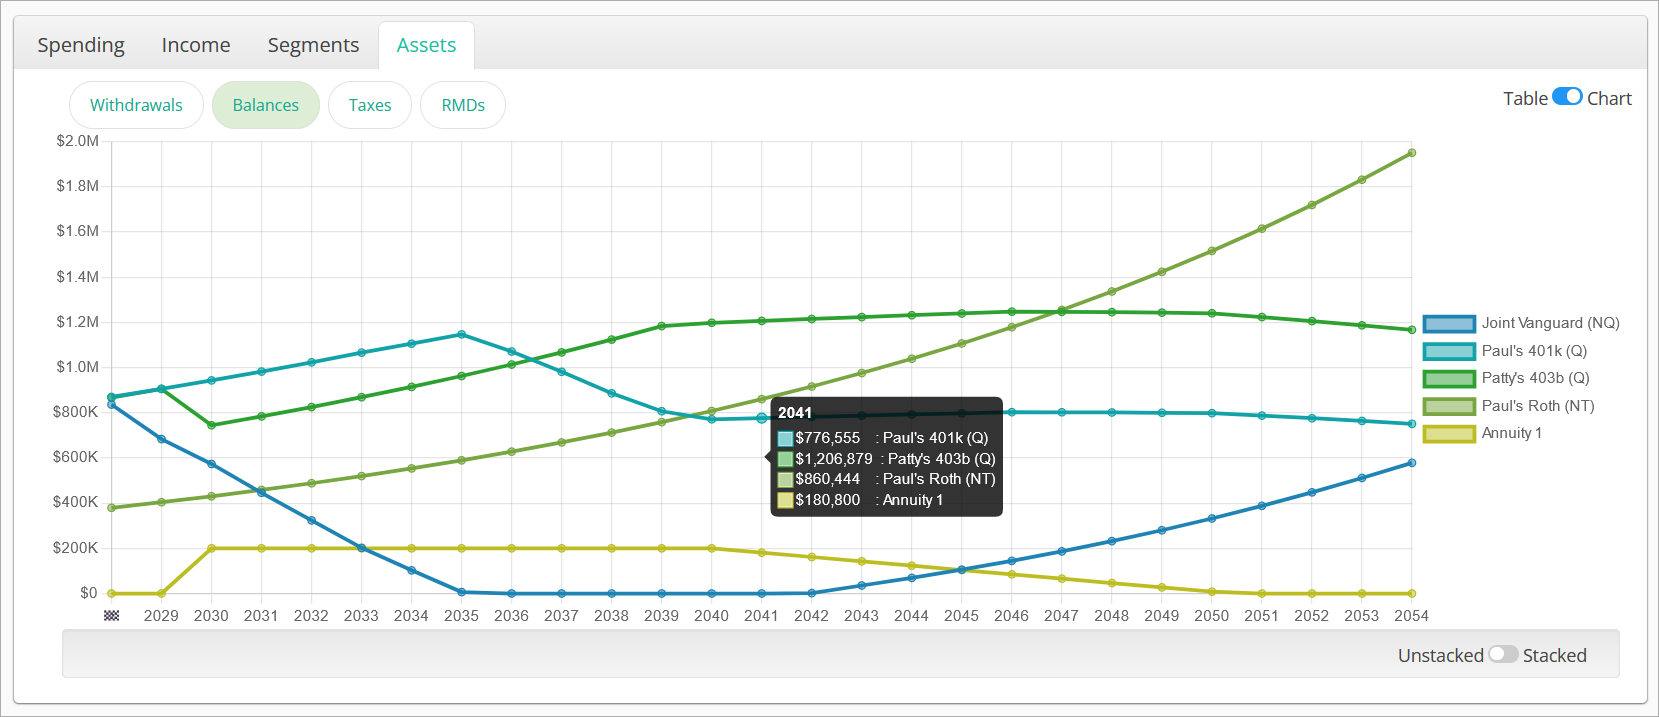
In the bottom right corner of the view area, there is an option to toggle between Unstacked and Stacked.
Stacked, enabled by default, shows the account values as a mountain chart so that the total projected household value is visually obvious by tracing the top line.
Unstacked shows the absolute account values along the same axis so that individual account values are more visually obvious.
Taxes

Taxes shows an individual item for each type of tax incurred over the length of the plan as well as an annual effective rate (total tax paid / total gross income) for each year. The items on this chart can include:
- Ordinary
- Long-Term Cap Gain
- NIIT (Net Investment Interest Tax)
- IRMAA (Income-Related Monthly Adjustment Amount)
- State
- FICA (Federal payroll tax)
- SECA (Self-Employed Contributions Act tax)
- Medicare Tax
- Penalties
- Effective Rate
Hovering over a column will show the total projected amount for each tax type and effective rate incurred during the associated year. The table view shows all projected amounts for all taxes in all years, including totals.
The Taxes view is also available under the Spending tab.
RMDs
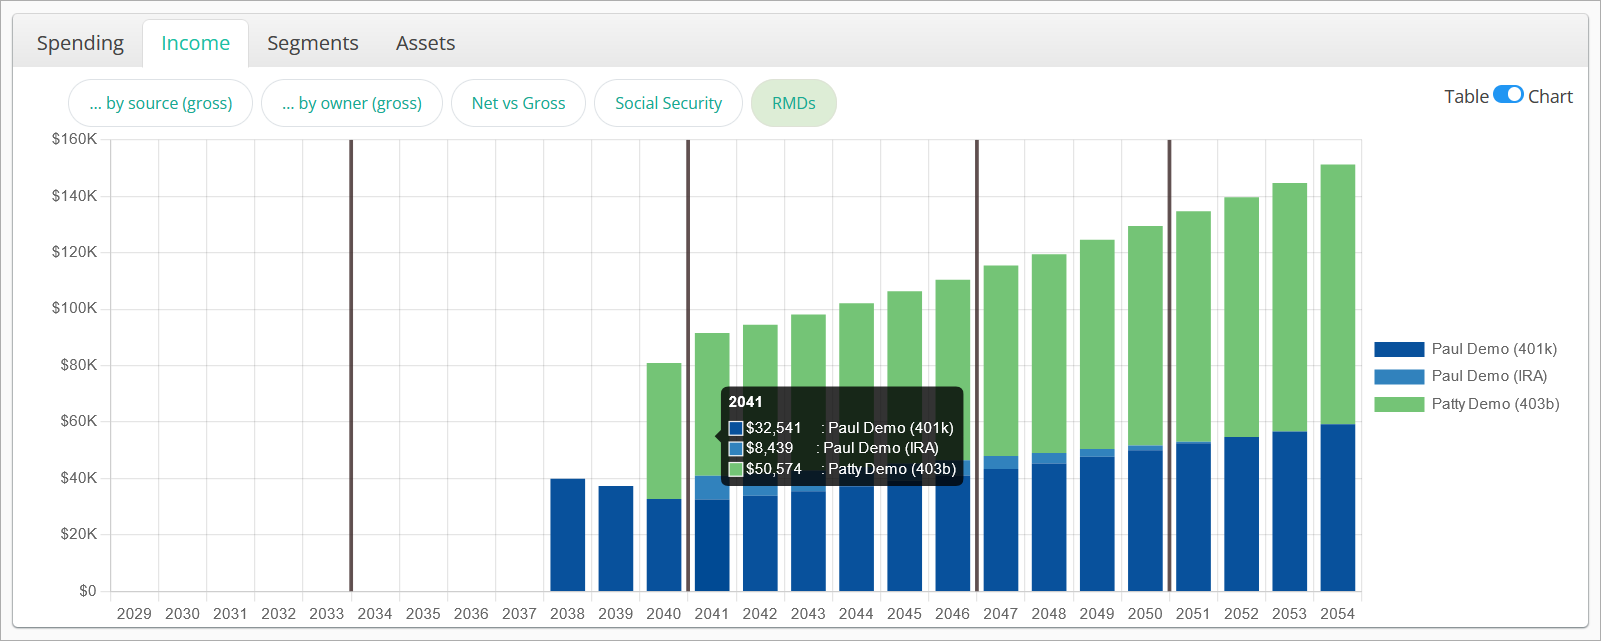
RMDs shows the projected Required Minimum Distributions for each account type by client.
Hovering over a column will show the total projected RMD for each client over the year. The table view shows all projected RMDs for each owner in all years, including totals.
The RMDs view is also available under the Income tab.