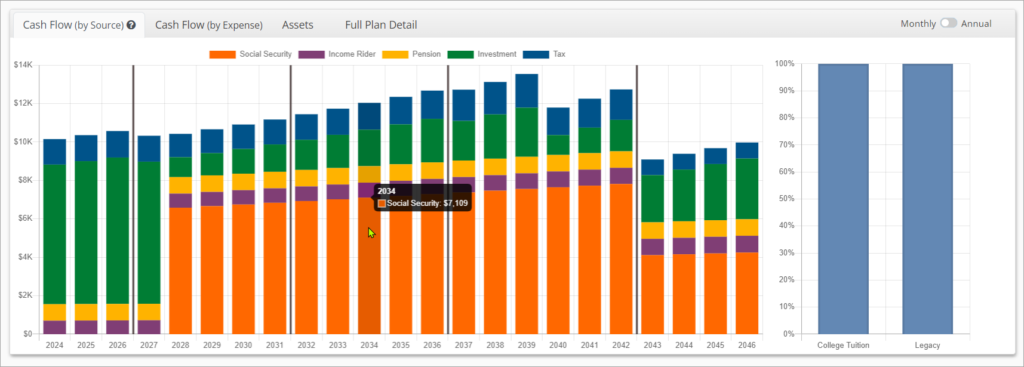
The Cash Flow (by Source) Chart illustrates planned income by source for every year of the plan. It will automatically update when plan assumptions are changed.
By default, all figures shown when you hover over an income source are monthly net income figures for the first month of the corresponding year. The estimated monthly tax liability is shown at the top of the column in blue.

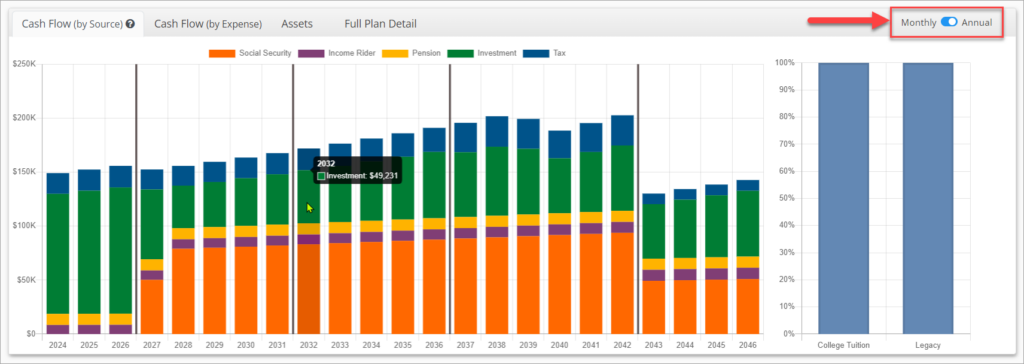
You can also toggle the chart to show cumulative annual figures for each year by switching from Monthly to Annual in the top right corner of the tab. This view can help to better illustrate periods where income is changing in the middle of a calendar year.

The x-axis of the chart shows calendar years of the plan. Keep in mind that there may be a partial calendar year at the beginning of the plan if the plan starts on a month other than January.
The y-axis shows income in $. It will automatically adjust scale when switching between Monthly to Annual views.

Each type of income source is shown as a different color in the chart. The colors will be assigned based on the order of the Income Floors. There is a legend at the top of the chart showing which color corresponds to which income source type. Investment income is always in green, and taxes are always in blue.
The vertical dark grey lines represent the beginning of a new segment. The divisions between segments can be adjusted in the Segments tab.
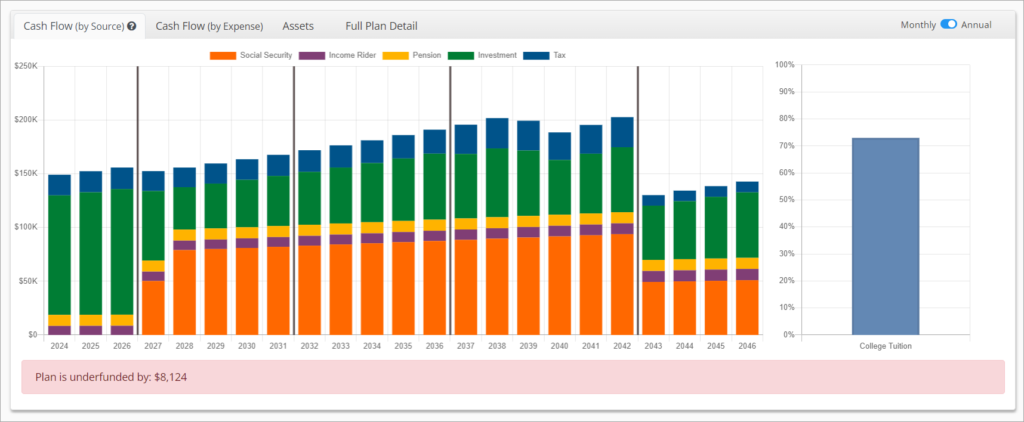
If Outside segments are included in the plan, their funding level in % will be shown in blue vertical bars to the right of the Cash Flow (by Source) Chart.
Funding Deficits

If the plan has a deficit and cannot fund all stated goals, including outside segments, the value of the deficit will be shown below the chart in red. You’ll notice that the chart above shows a plan where all of the income segments can be funded, but the outside segments can be partially funded or not funded at all.

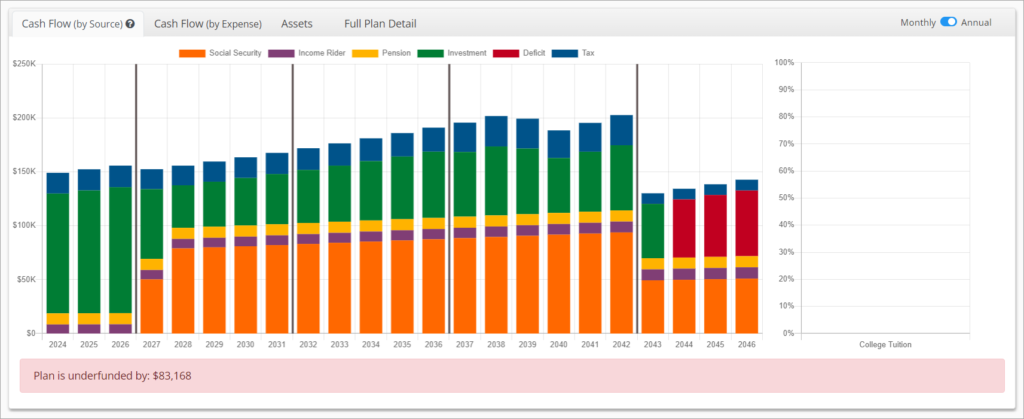
If the plan has a deficit severe enough that the income segments cannot be funded, the value of the deficit will be shown in red below the chart. You will also see red replacing the green investment income bars for years that are partially funded or unfunded. Learn more about techniques for addressing plan deficits in the Tuning Tip Using Expense-Level Inflation to Tackle Deficits.