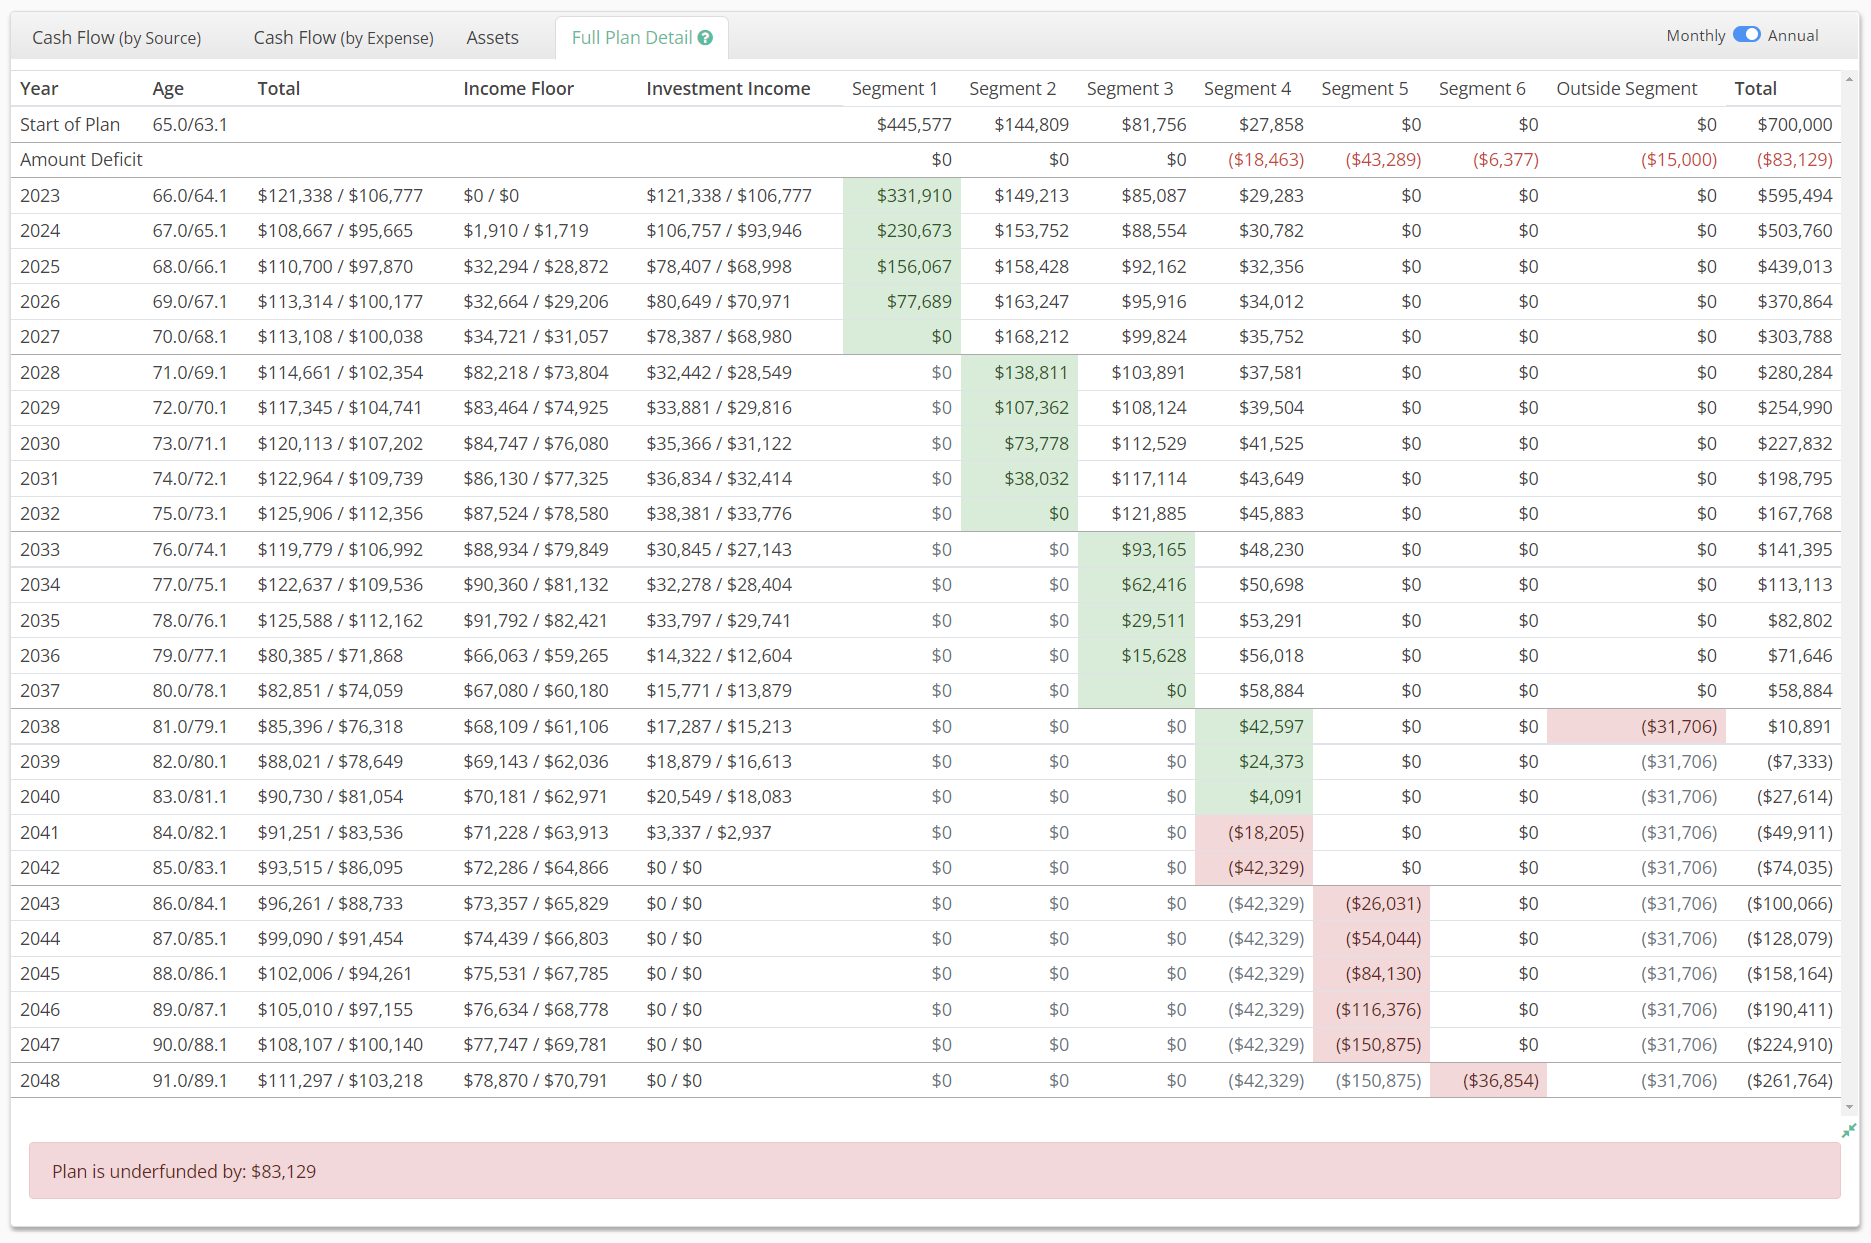
The full plan detail tab displays the income and asset values that the Cash Flow and Assets charts are illustrating. The years during which a segment distributes are shaded in green.

The first row of the table displays data as of the plan start date. These are initial target values for all segments required to meet their income goals based on the assumed growth and distribution rates-of-return.
By default, all income figures shown are monthly net income figures for the first month of the corresponding year.
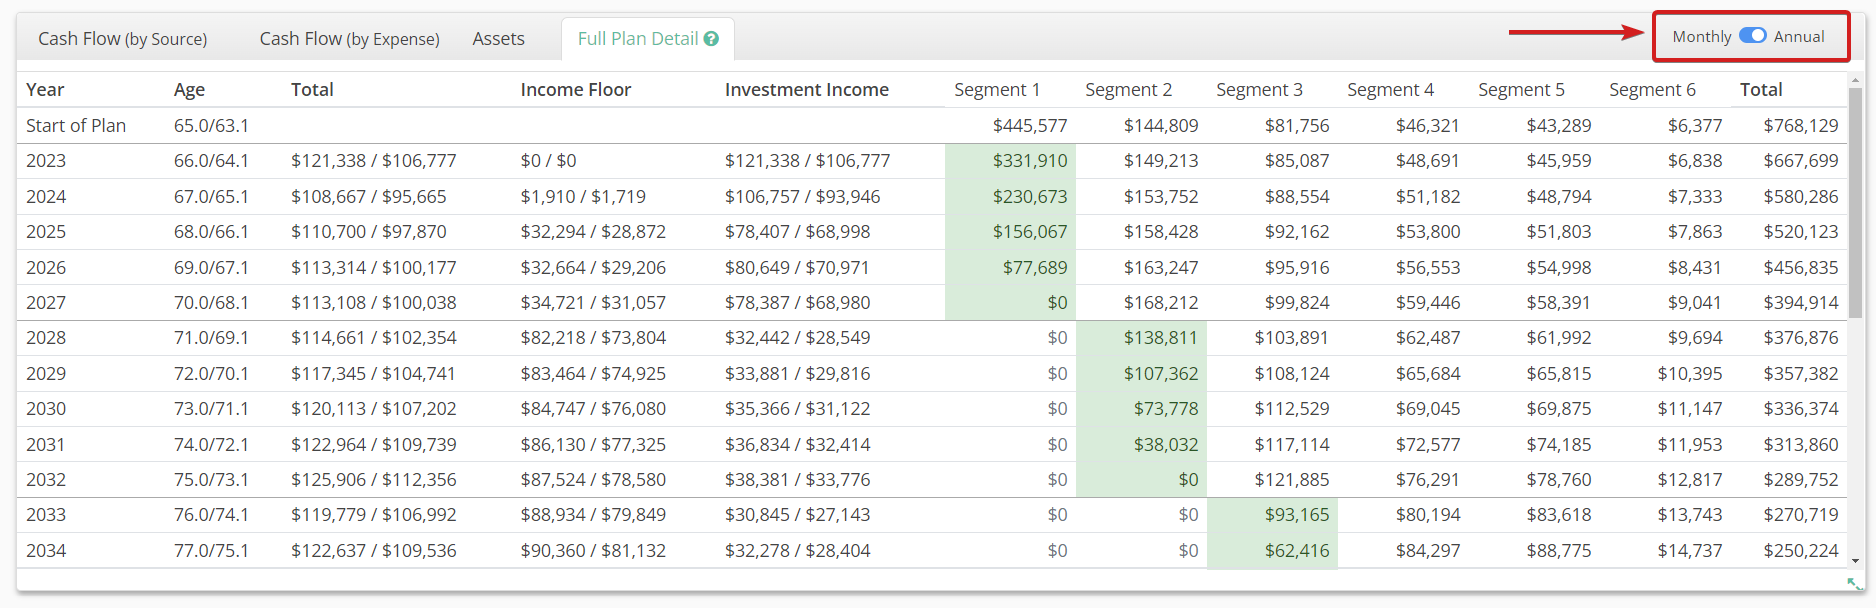
You can also toggle the table to show cumulative annual figures for each year by switching from Monthly to Annual in the top right corner of the tab. This view can help to better illustrate periods where income is changing in the middle of a calendar year.
The columns in the Full Plan Detail table are:
Year: The number of years that have elapsed since the plan start date.
Age: Age of the client(s) as of the end of each plan year.
Monthly: Total gross and net monthly income for each plan year.
Income Floor: Total gross and net monthly income that is projected to be provided by sources of income such as Social Security, pensions, etc. for each plan year.
Investment Income: Total gross and net monthly income that is projected to be generated by investment liquidation from the currently distributing segment.
Segments: Year-end values of all segments, both income generating as well as outside segments.
Total: The total estimated combined value of all plan segments as of year-end for each plan year.
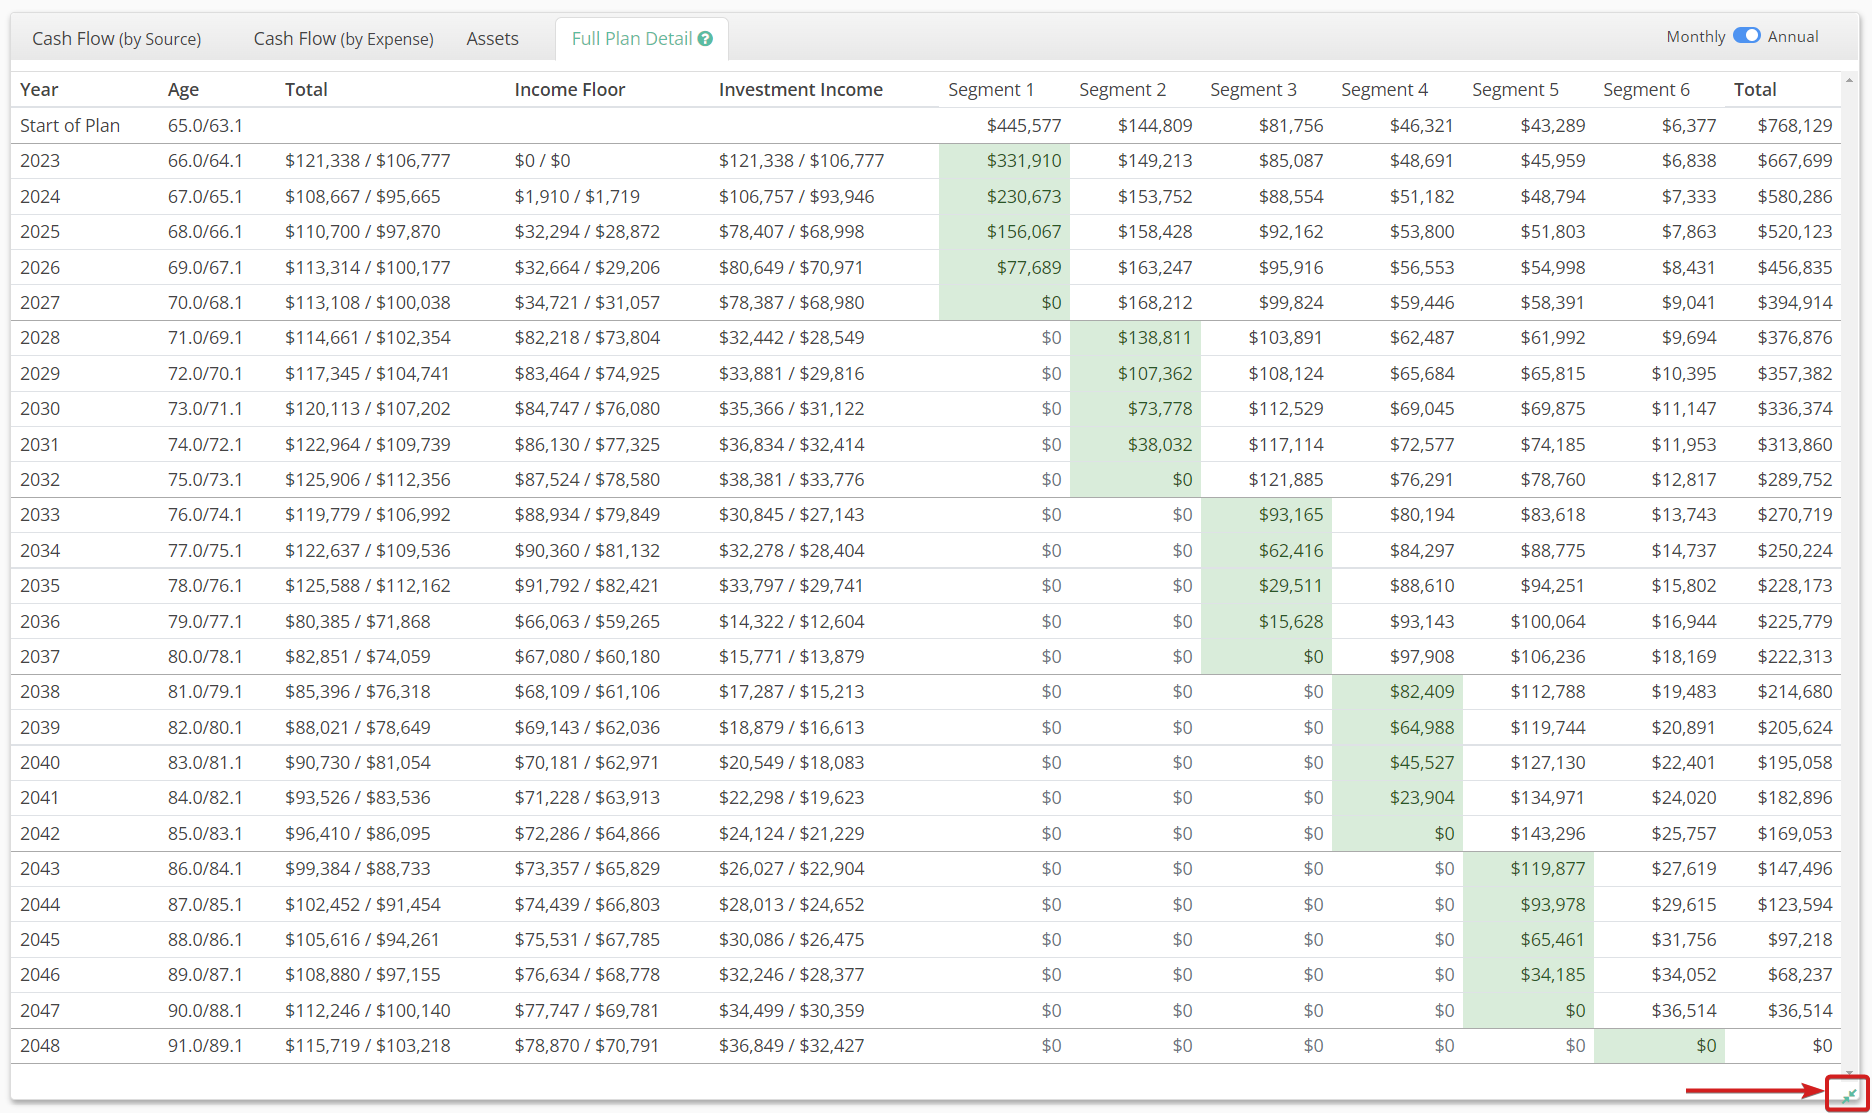
You can expand the Full Plan Detail by clicking on the double arrow icon in the bottom right of the chart. This view will show all plan years.
If the plan is in a funding deficit, the value of the deficit will be shown beneath the table in red. The years in which an underfunded or unfunded segment fails to provide its target income will be shown in red with negative balances. Outside segments will display a negative balance upon their year of projected distribution if they are partially or fully underfunded.