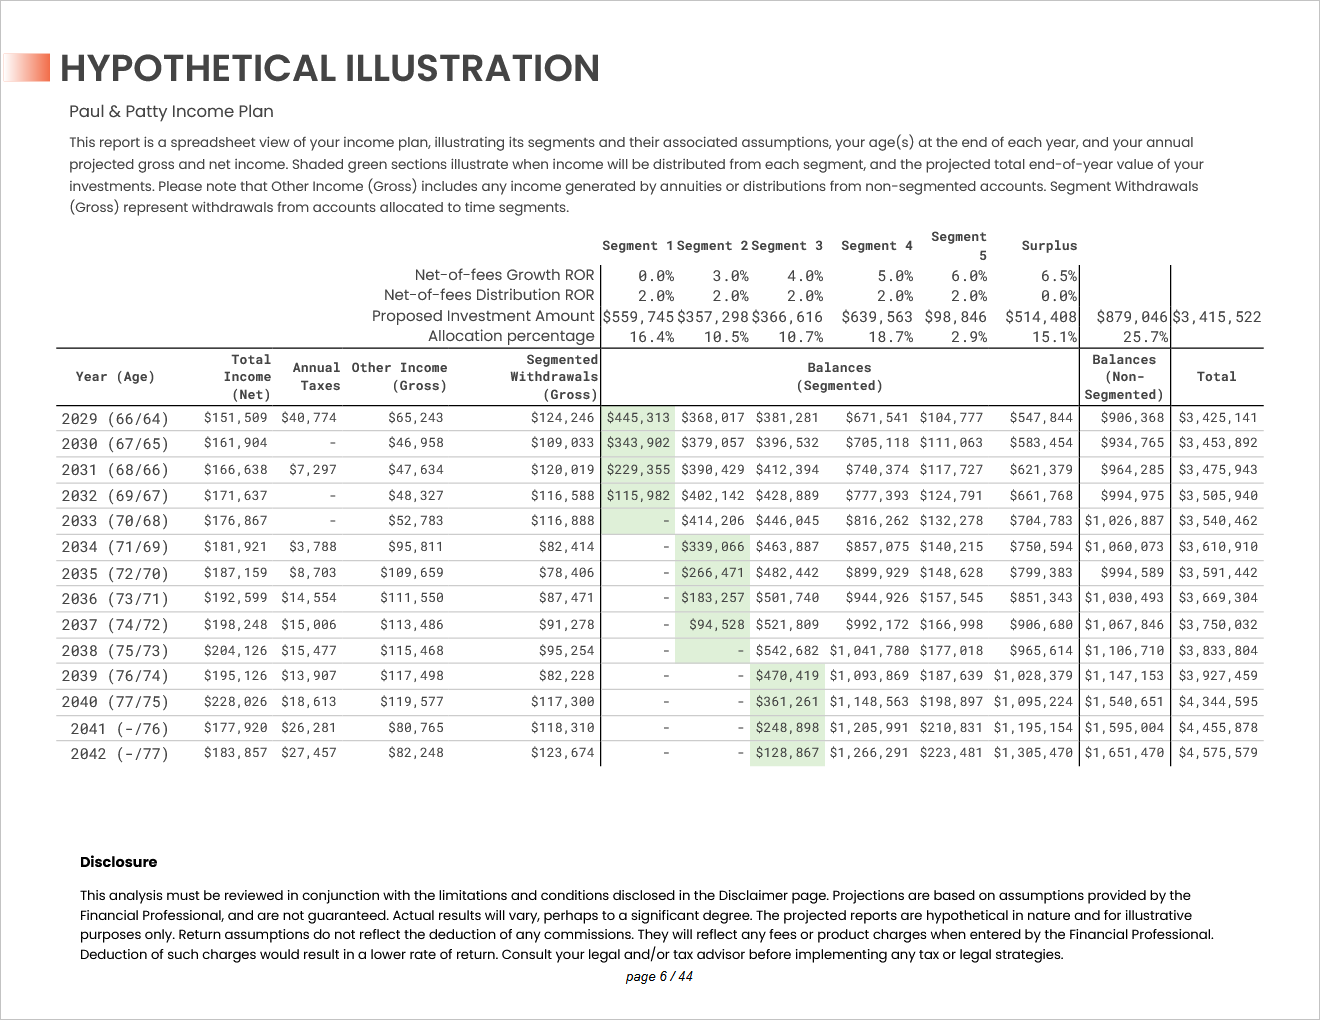
The Hypothetical Illustration is a report module that shows projected annual income by source, segment assumptions, and projected end-of-year segment balances. Projected annuity cash values as well as the value of other non-segmented account types are summed up into the Balances (Non-Segmented) column.
Segment names are displayed across the top of the table with their attributes listed below.
Net ROR is the assumed net-of-fees average annualized rate of return target for the segment during its growth phase. Segment 1 will only have a non-zero Net ROR if annual distribution for NQ accounts is enabled.
ROR During Distribution is the assumed net-of-fees average annualized rate of return target for the segment during its distribution, or “draw down” phase. The years highlighted in green on the table below represent the distribution phase of the segment.
Proposed Investment Amount is the projected asset level at which the segment will be funded as of the plan start date. Additional assets may be added to the segment after plan start due to delayed spousal retirement or excess income reinvestment. This value does not include projected cash values of annuities modeled in the plan.
Allocation Percentage is the projected % of the total household account assets that will be invested in each segment at plan start.

Each calendar year in the plan shows the age that clients will be as of year-end.
Total Income (Net) is the projected total annual net (after-tax) income for the household. This figure includes any projected excess income.
Annual Taxes is the projected total annual taxes and penalties.
Other Income (Gross) is the projected total annual gross (pre-tax) income from sources other than segmented account withdrawals such as Social Security and annuity income payments.
Segmented Withdrawals (Gross) is the projected total annual gross (pre-tax) withdrawals from accounts allocated to the segment currently in distribution.
Jump to the next report module: