The Track area of IncomeConductor contains all of the important information you need to monitor, analyze, and report on the progress of your clients’ income plans. This article will cover the various data and calculations on this page.
For a plan to appear in the Track area, it must be in Approved status and must have been initiated. For more on initiating a plan, read about the Invest area.
Tracking Dashboard Layout
Let’s step through each of the columns on the dashboard.
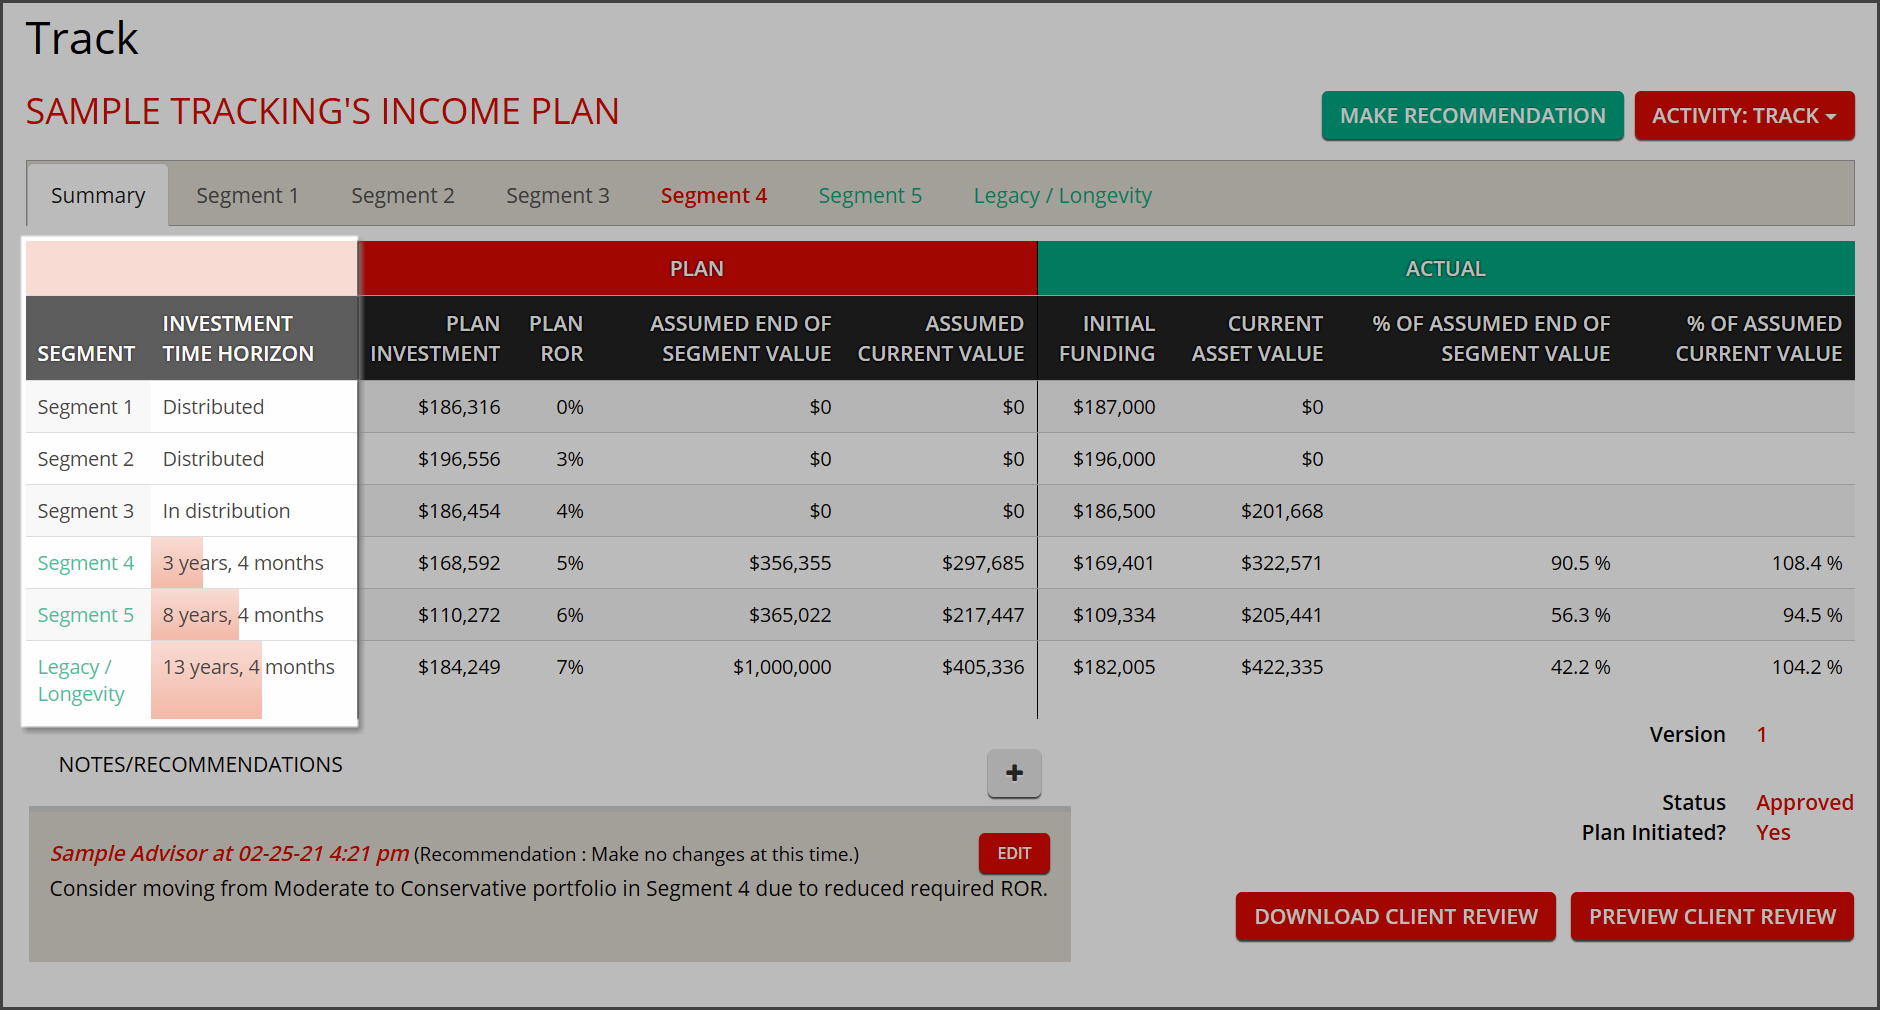
Segment – The names of plan segments are listed in order of scheduled distribution. Any segments that have not yet come up for distribution will be clickable links to access deeper analytics.
Investment Time Horizon – The number of years remaining until a segment is targeted to convert from its growth phase to its distribution phase. Segments that have been depleted will show as Distributed, and the segment currently providing income will show as In Distribution.
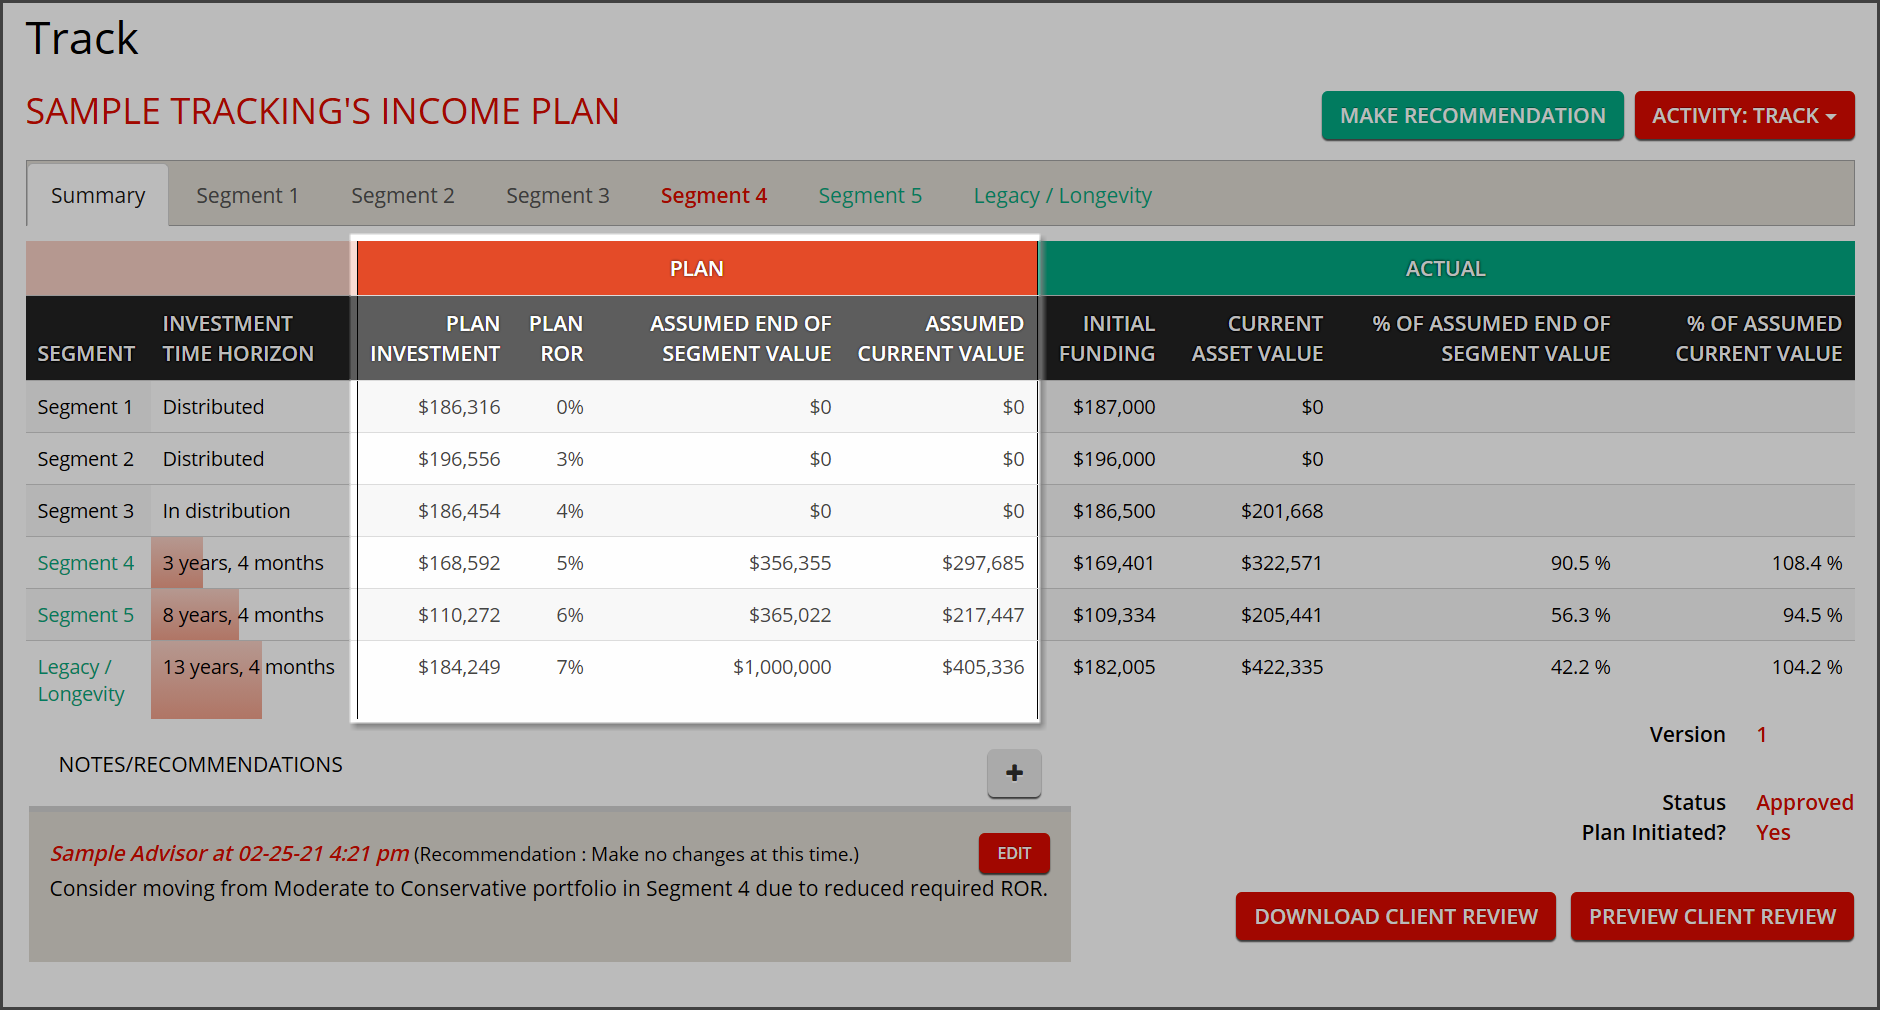
The data under the Plan column header are based on assumptions and projections from the Approved income plan.
Plan Investment – Required funding level for the segment at plan start.
Plan ROR – Illustrated rate of return goal assigned to the segment.
Assumed End of Segment Value – Illustrated segment balance at the point when it is scheduled to convert from its growth phase to its distribution phase.
Assumed Current Value – Illustrated segment balance as of today based on time elapsed in the plan and the Plan ROR of the segment.
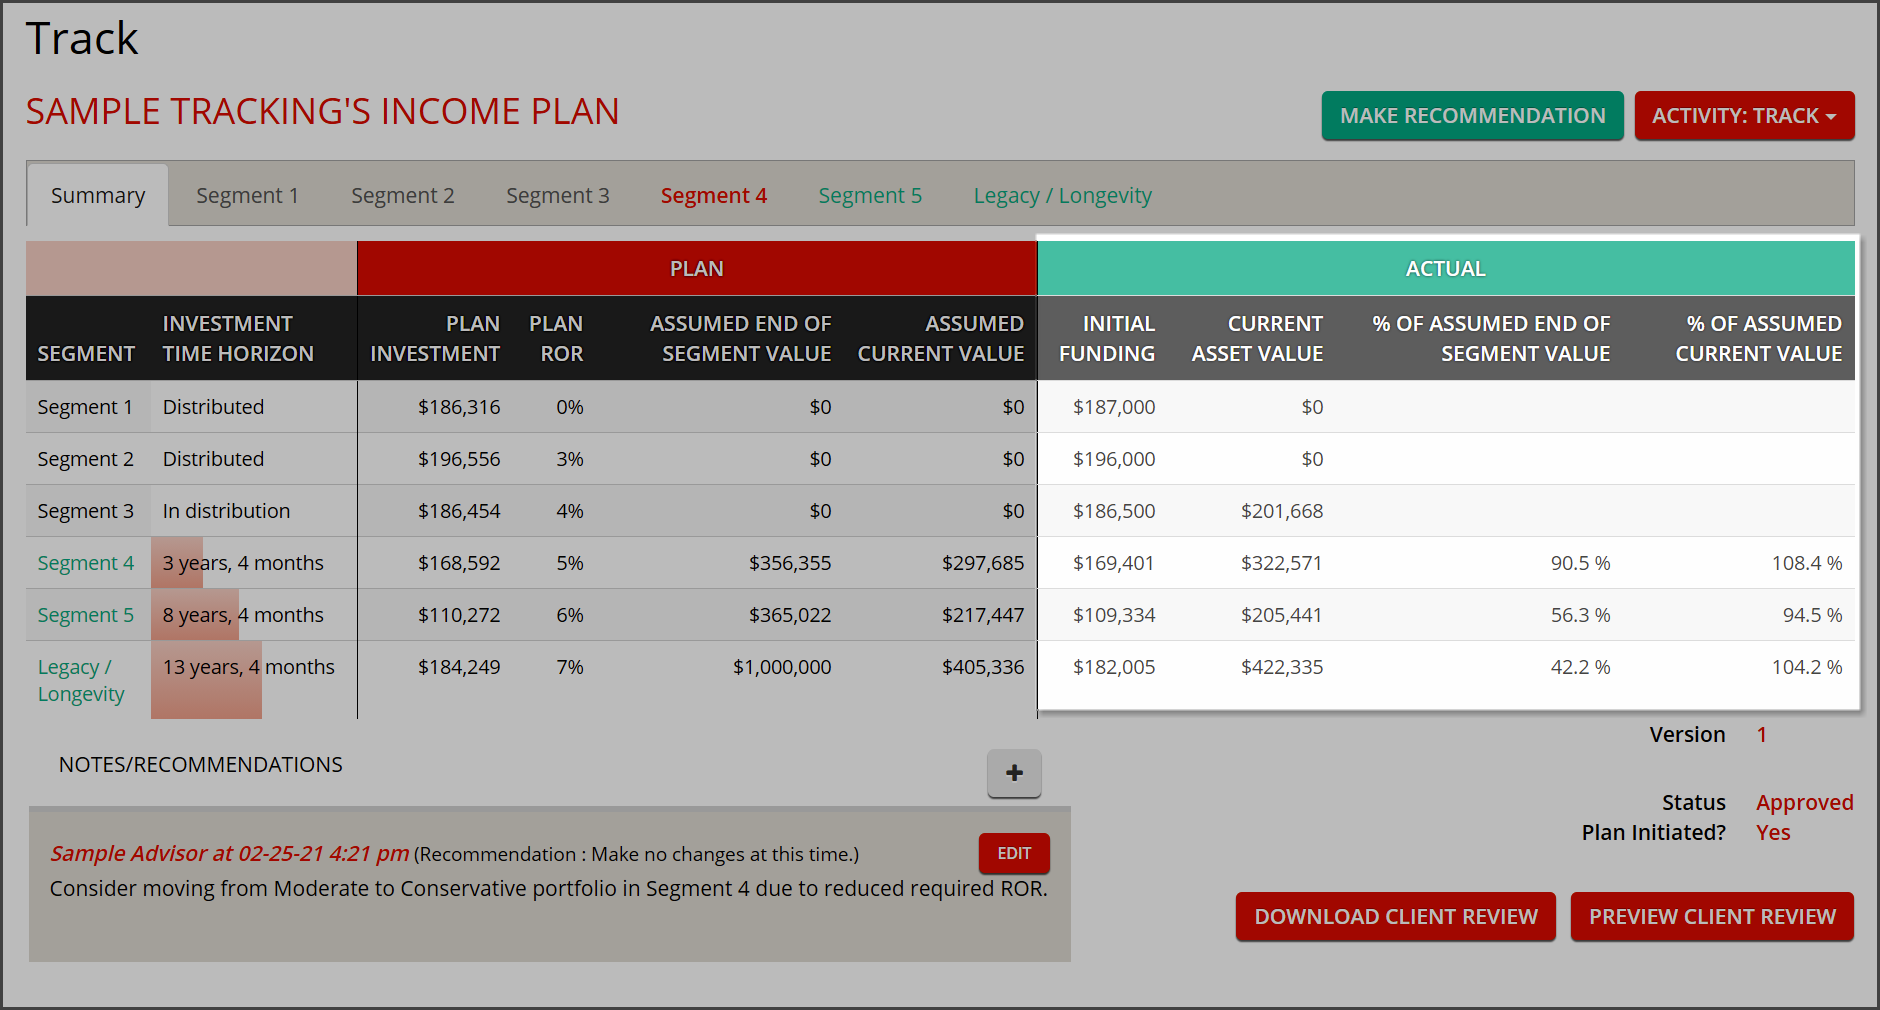
The data under the Actual column header are calculated from the aggregate value of the assets linked to each segment.
Initial Funding – Value of assets linked to the segment at the point of plan initiation.
Current Asset Value – Value of assets linked to the segment as of today.
% Assumed End of Segment Value – Measure of progress towards the Assumed End of Segment Value.
% Assumed Current Value – Measure of progress relative to the Assumed Current Value.
Making Recommendations
When performing reviews, it is important to assess each segment’s analytics, and enter your recommendations and decisions into the system for future reference. By clicking Make Recommendation, a pop-up will open.
The pop-up contains a free text field where you can enter your notes, as well as a number of additional data points on the segment. When you click Save Recommendation, whatever has been entered into this field will be saved and date-stamped. It will then appear on all subsequently run Client Review Reports for this plan.
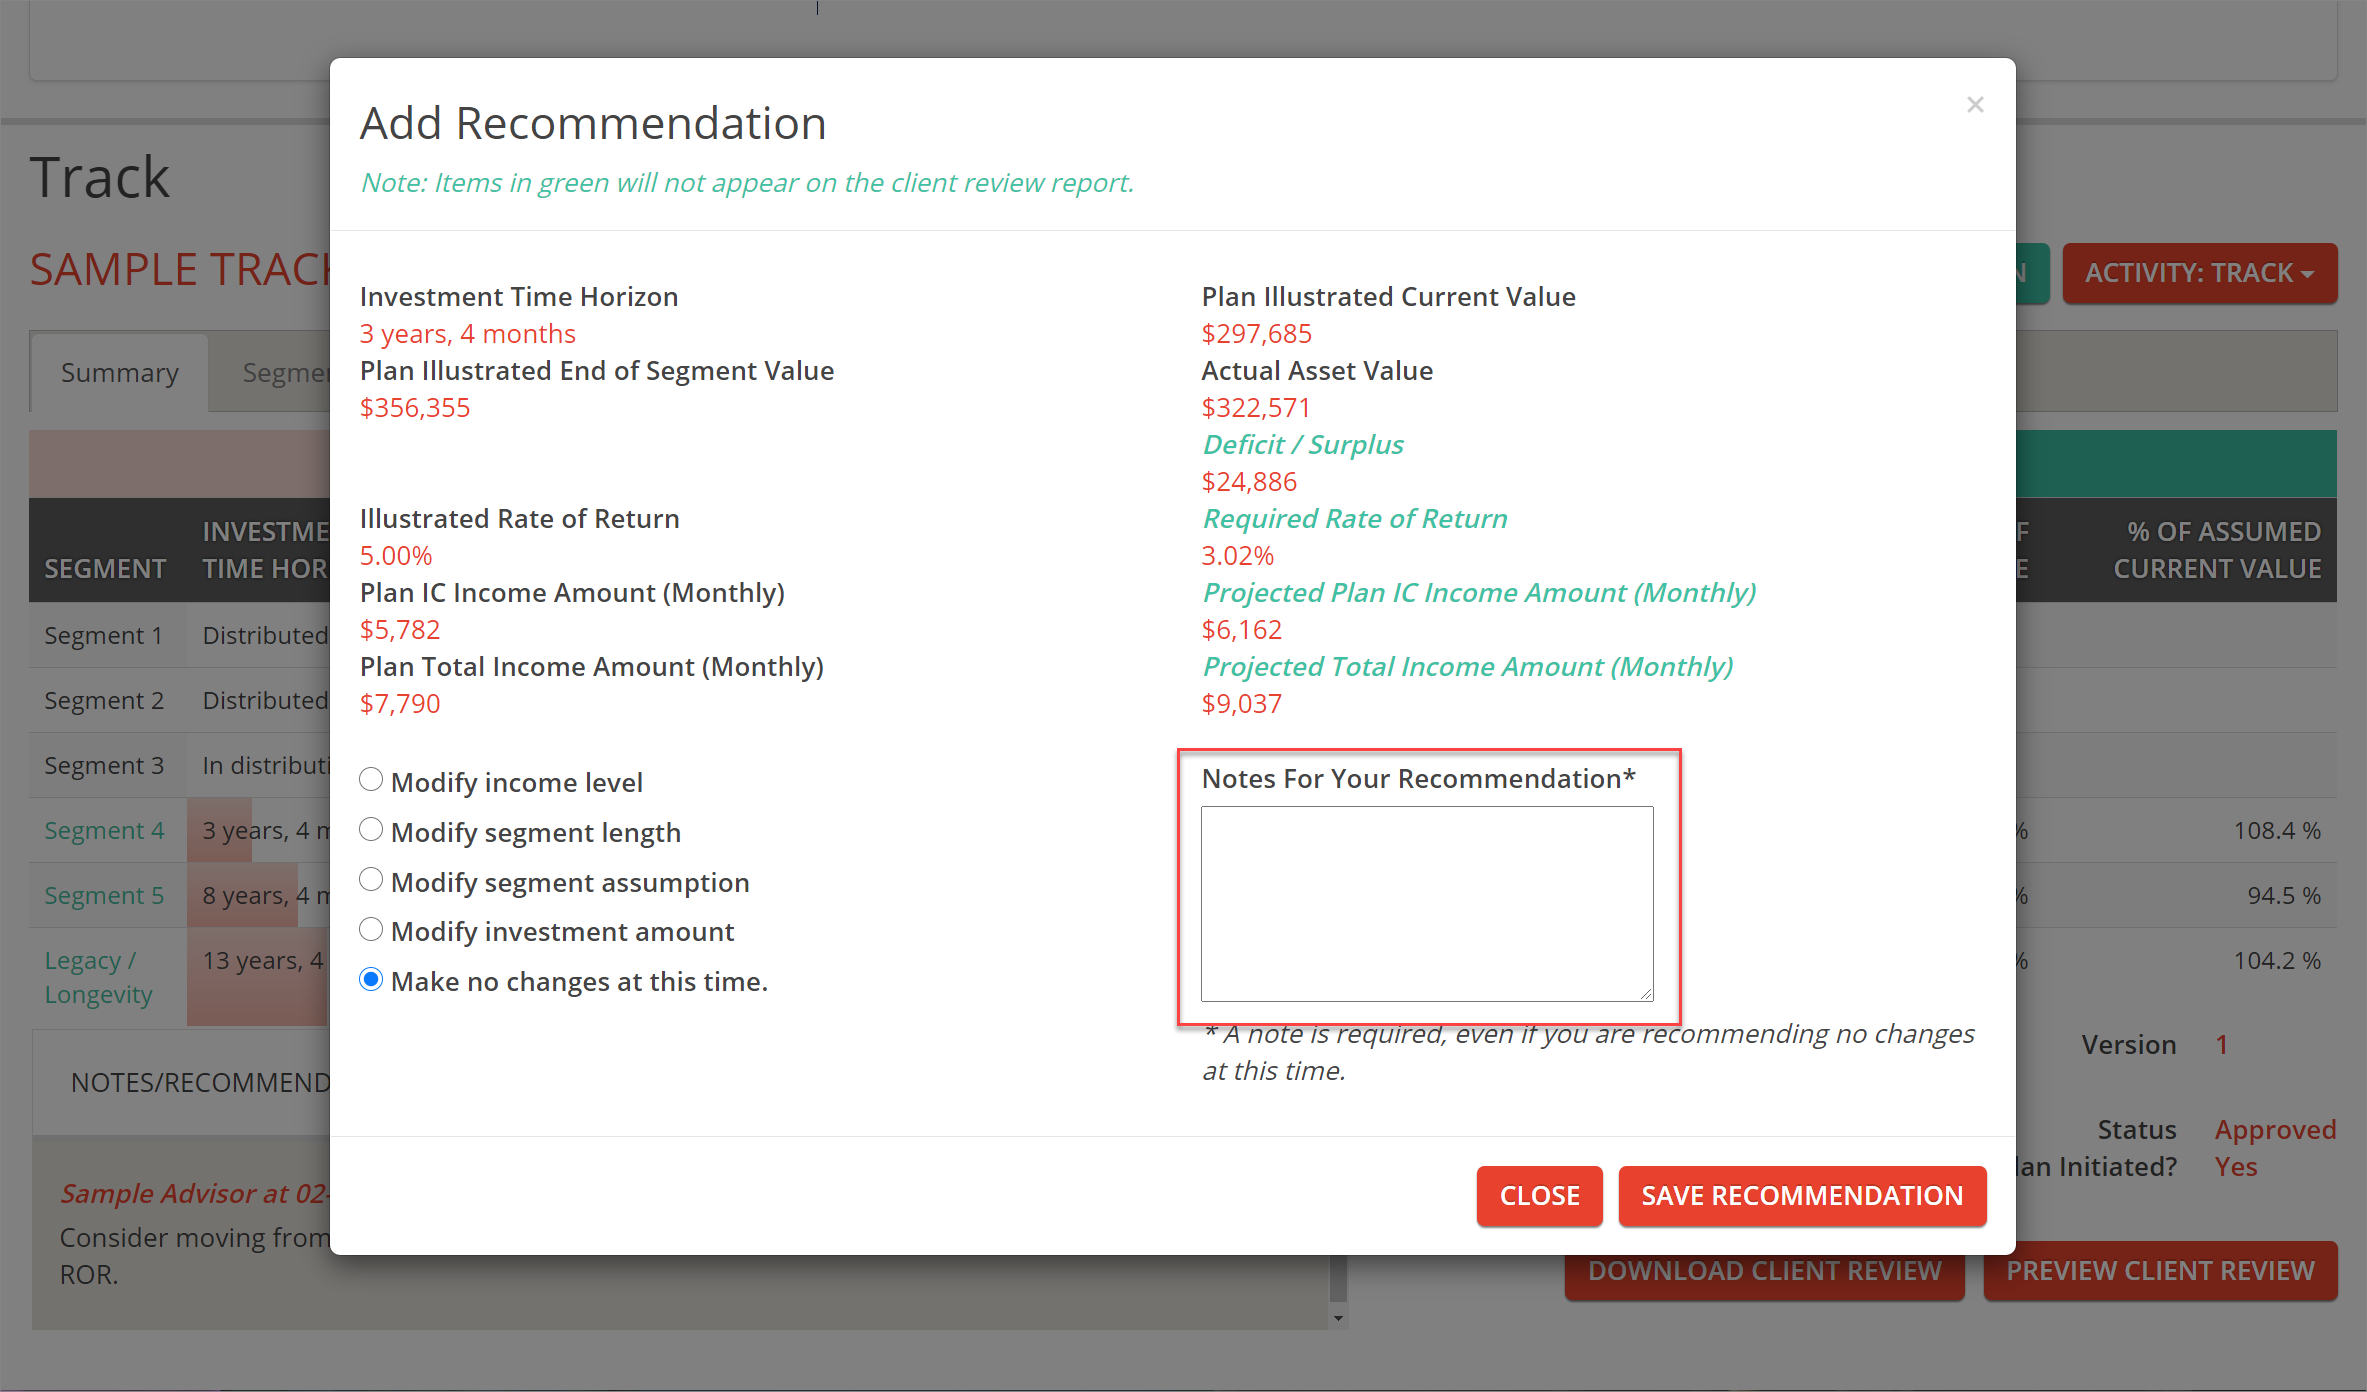
You’ll recognize some of the data from the dashboard itself, such as Illustrated Current Value and Actual Asset Value. There are additional analytics as well:
Plan Income (Monthly) – The original illustrated starting monthly income goal from this segment’s investments.
Plan Total Income (Monthly) – The original illustrated starting monthly income goal including both this segment’s investments and the income floors available during the segment’s distribution phase.
Projected Plan Income (Monthly) – The anticipated starting monthly income available from the segment’s investments based on its current value.
Projected Total Income (Monthly) – The anticipated starting monthly income income available from both the segment’s investments and the income floors available during the segment’s distribution phase.
There are also two key pieces of information visible in this pop-up.
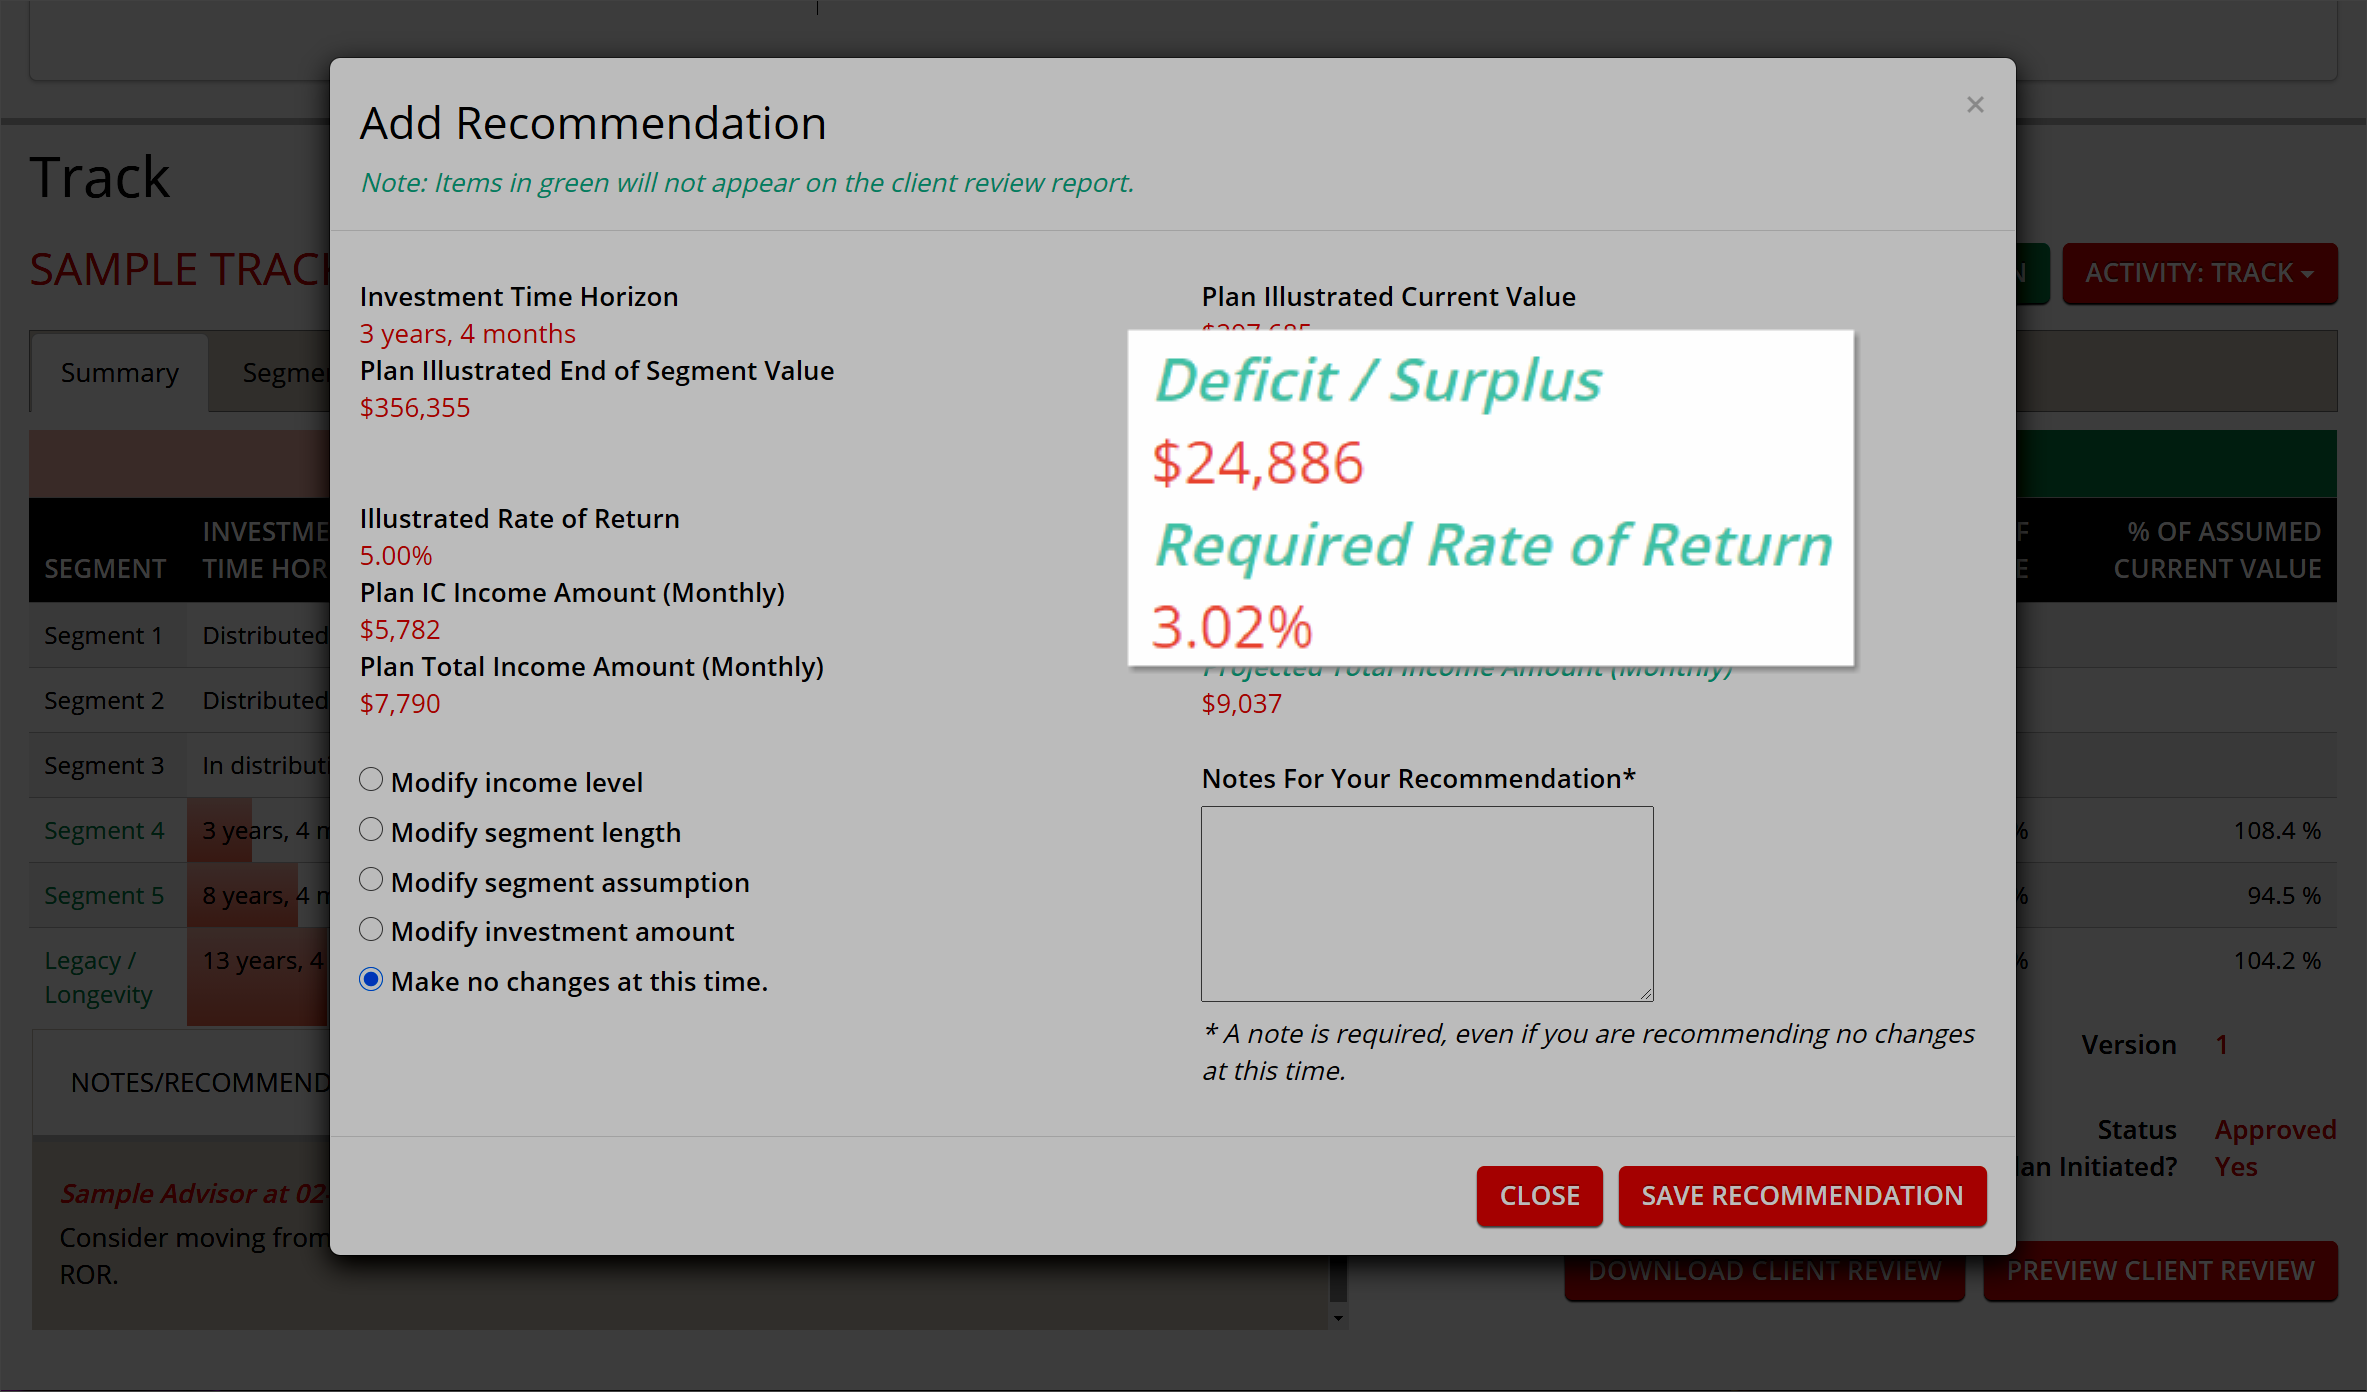
Deficit / Surplus – This is the dollar figure difference between the Illustrated and Actual Current Asset Values. Basically, how far ahead or behind plan is this segment’s assets.
Required Rate of Return – Every segment has an illustrated ROR, but every day that the segment’s asset value fluctuates, the average annualized ROR that must be achieved to reach the Plan Illustrated End of Segment Value.
These data points are very powerful, as they can help inform decisions about protecting future income when there are opportunities to potentially rebalance into a more conservative portfolio or guaranteed product.
If the Required Rate of Return reaches or dips below 2.00%, an email alert will be generated to the address used as your login to IncomeConductor. Read more about De-Risking Alerts.