Roth Conversion Strategy detail is a report module that focuses on the estimated tax impacts and asset flows projected from any Roth conversions modeled in the scenario, including both in periods prior to plan start and during the plan/after Segment 1 start.
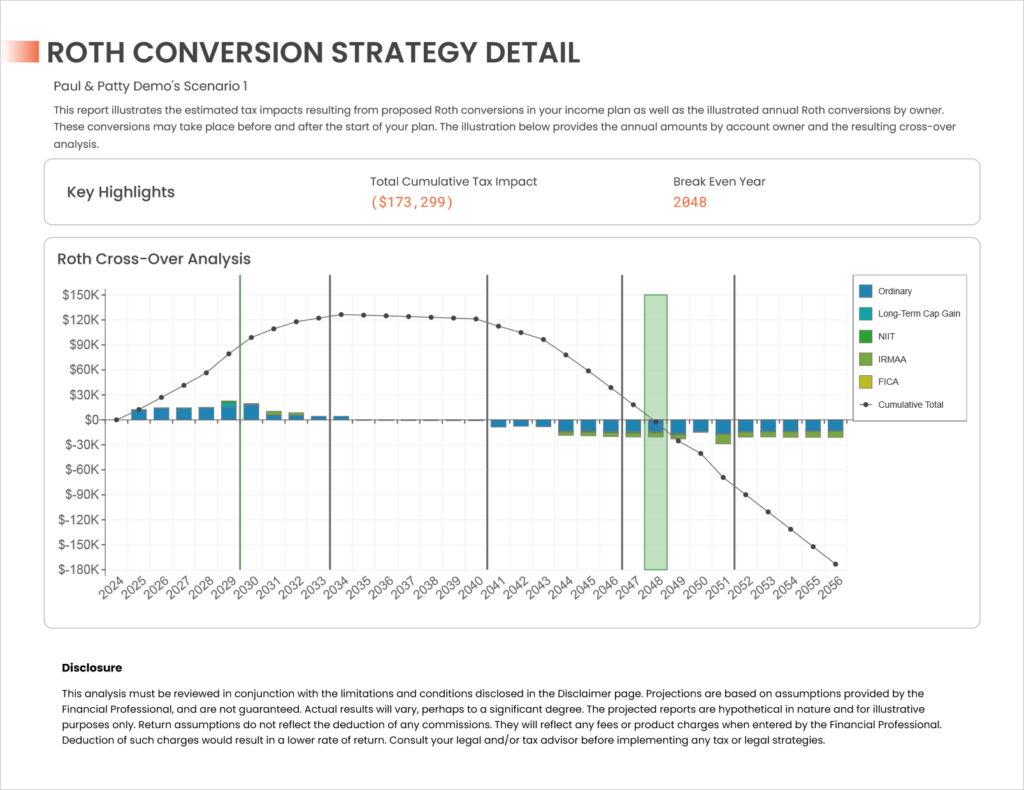
The first page of the module includes as chart as well as the following Key Highlights:
Total Cumulative Tax Impact is the estimated difference in taxes from today until the end of the plan as a result of performing the proposed Roth conversions. A positive figure indicates that there is a net increase in taxes owed, while a negative figure indicates a net savings in taxes owed.
Break Even Year is the estimated year in which the total cumulative tax impact transitions from a net increase to a net savings. This may be blank if the total cumulative tax impact remains positive until the end of the plan.
The bars on the chart indicate additional taxes incurred or saved by type of tax. The line is the running cumulative net impact. The green annotated year is the break even year.

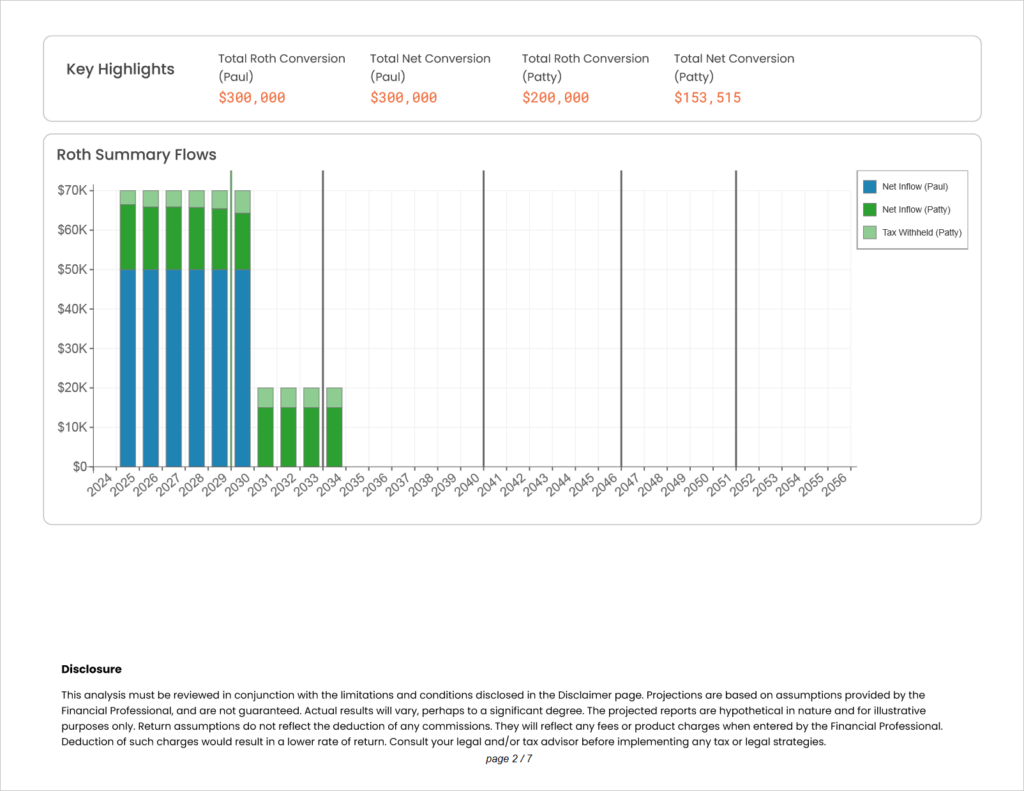
The next page in the module shows the projected asset flows as a result of the proposed Roth conversion strategy. If the tax treatment is to withhold taxes from conversion amounts, the chart will differentiate between proceeds that are deposited into the Roth and the withholding amount to cover the taxes associated with the conversion.
Total Roth Conversion is the sum of all assets withdrawn from the source qualified account to perform conversions, by owner.
Total Net Conversion is the sum of assets after any withheld taxes that were deposited into the Roth account, by owner.
If a conversion is set to have taxes paid for from a NQ account but that account’s balance goes to $0 before the conversion is complete, the conversion will switch over to withholding taxes from the conversion proceeds automatically.

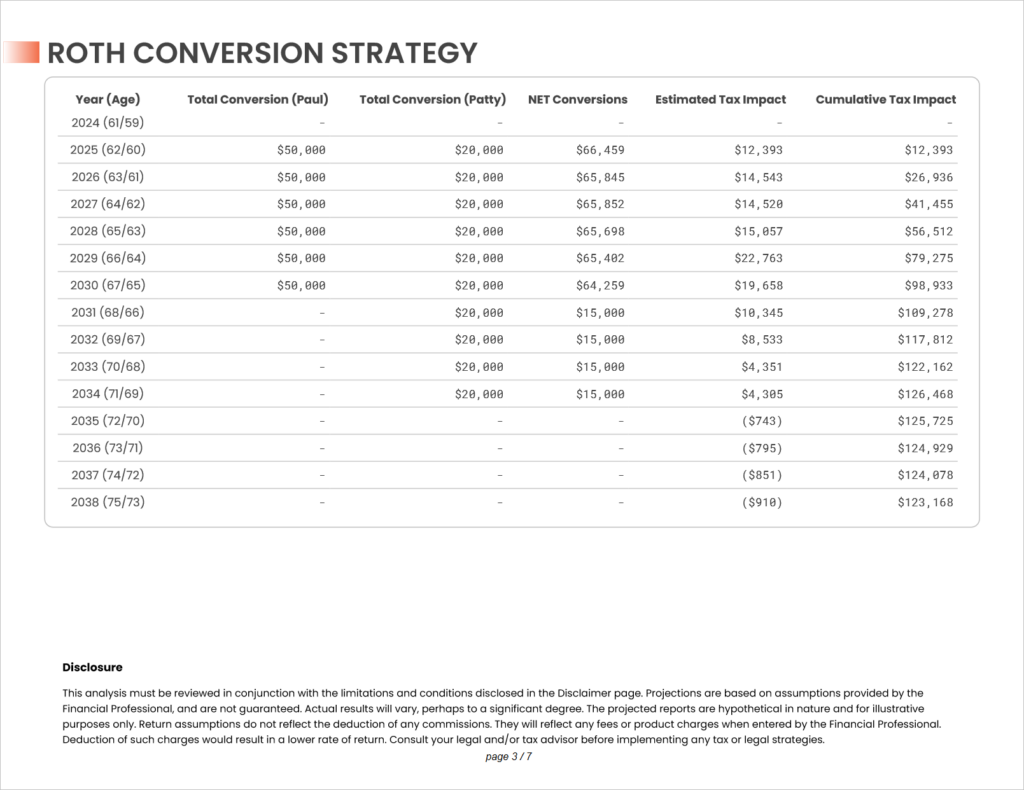
The final pages in the module include a data table that gives specific projected annual conversion amounts by owner, the total net conversions if taxes are withheld from the conversion, the annual estimated tax increase or savings due to the conversion, and the running cumulative tax impact. Totals are included at the bottom of the table. All ages are shown as of year-end.

Standard disclosures are provided in the footer, as well as additional disclosures specific to this illustration in the Disclosures section at the end of the report.
Jump to the next report module: