The Proposal is a report that can be run on plans in Proposed status. The Proposal is designed to illustrate all the plan data necessary for pitching an income plan to a client or prospect. Read on to learn about the different sections of the report.
Branded cover page
The logo and titling you provided upon sign up will appear on the cover page, with the status of the plan and the client name(s).
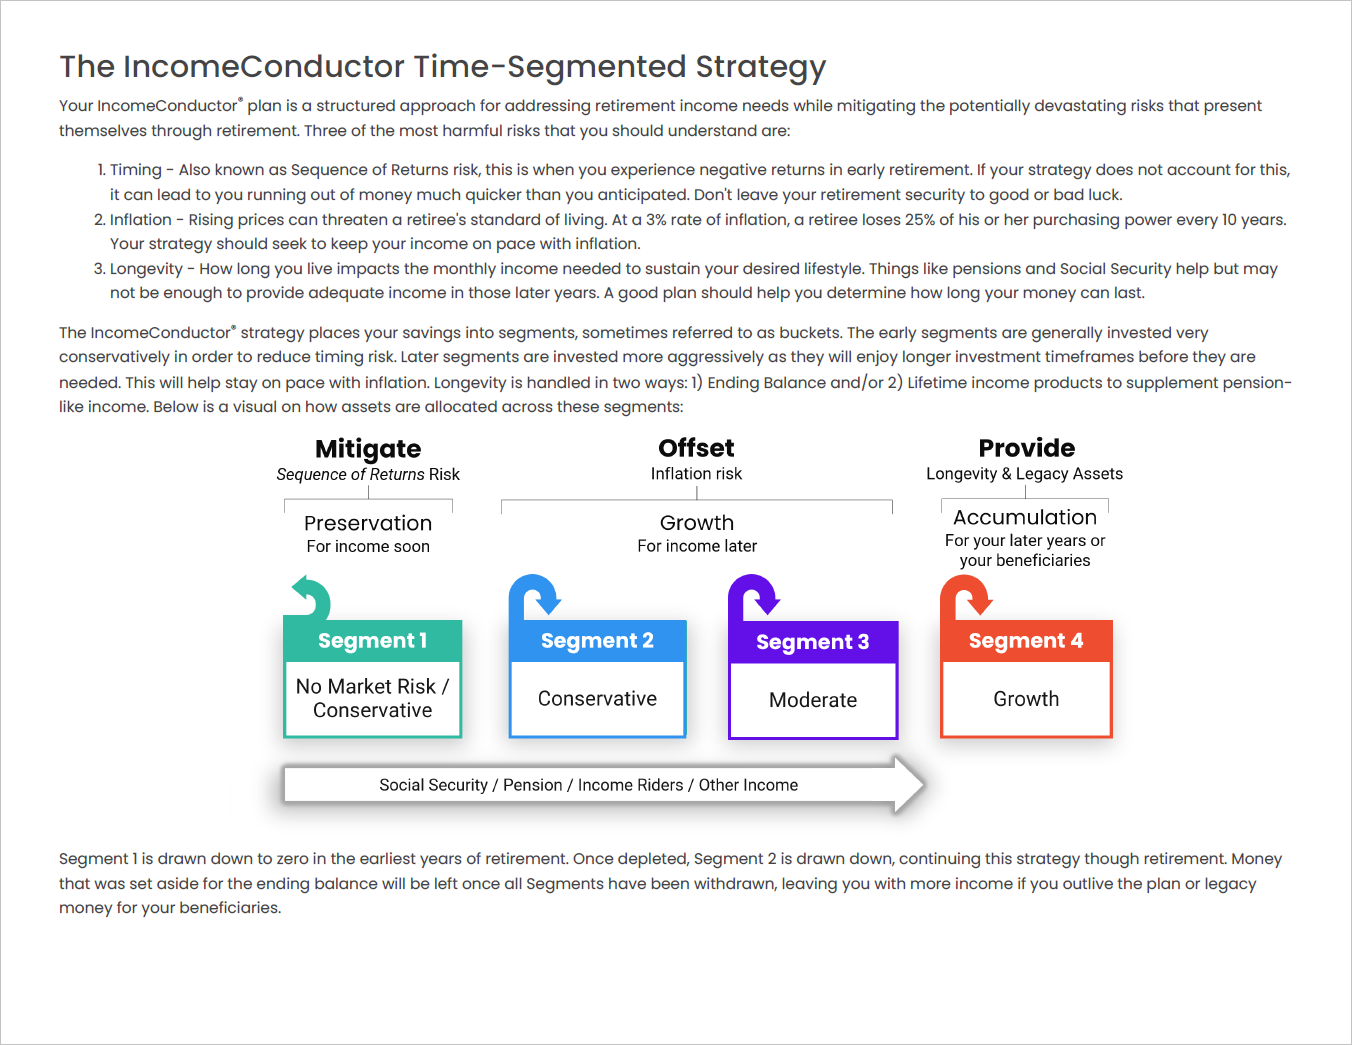
Introduction to Time Segmentation
The pages helps facilitate a conversation with your client about the aspects and potential benefits of time-segmented income distribution.
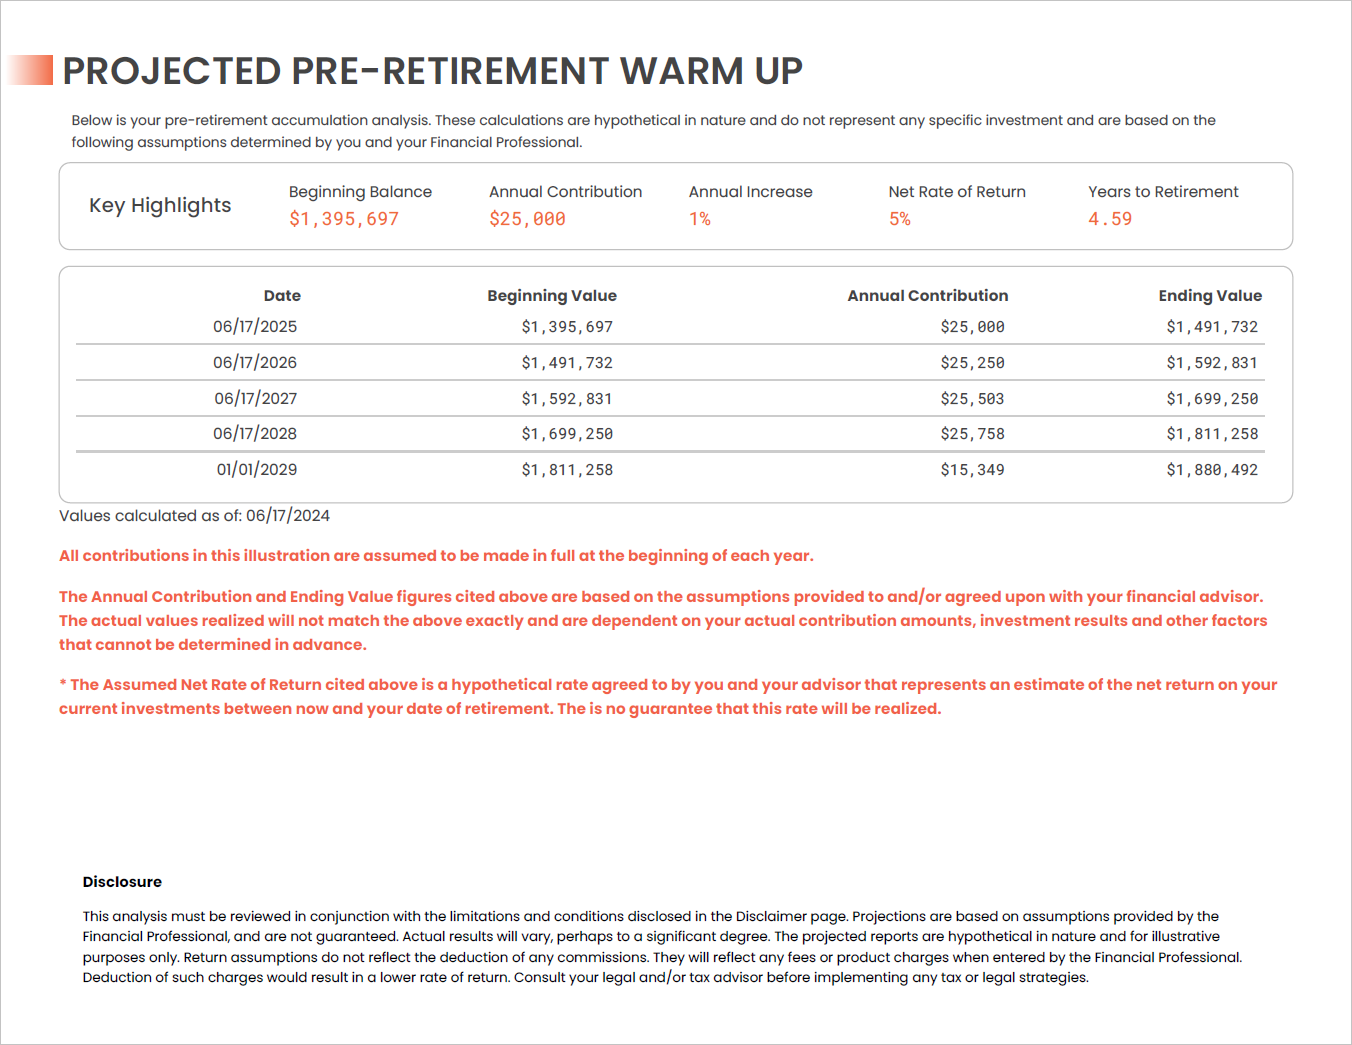
Pre-Retirement Warm Up (optional)
When a plan is slated to start more than a year from today, the Plan Editor will make a basic calculator available under the investment field in the Solve Settings tab. This calculator helps estimate a future asset level based on a current asset level and contributions and growth.
If you use this calculator, the Pre-Retirement Warm Up page will appear in reports for the plan.
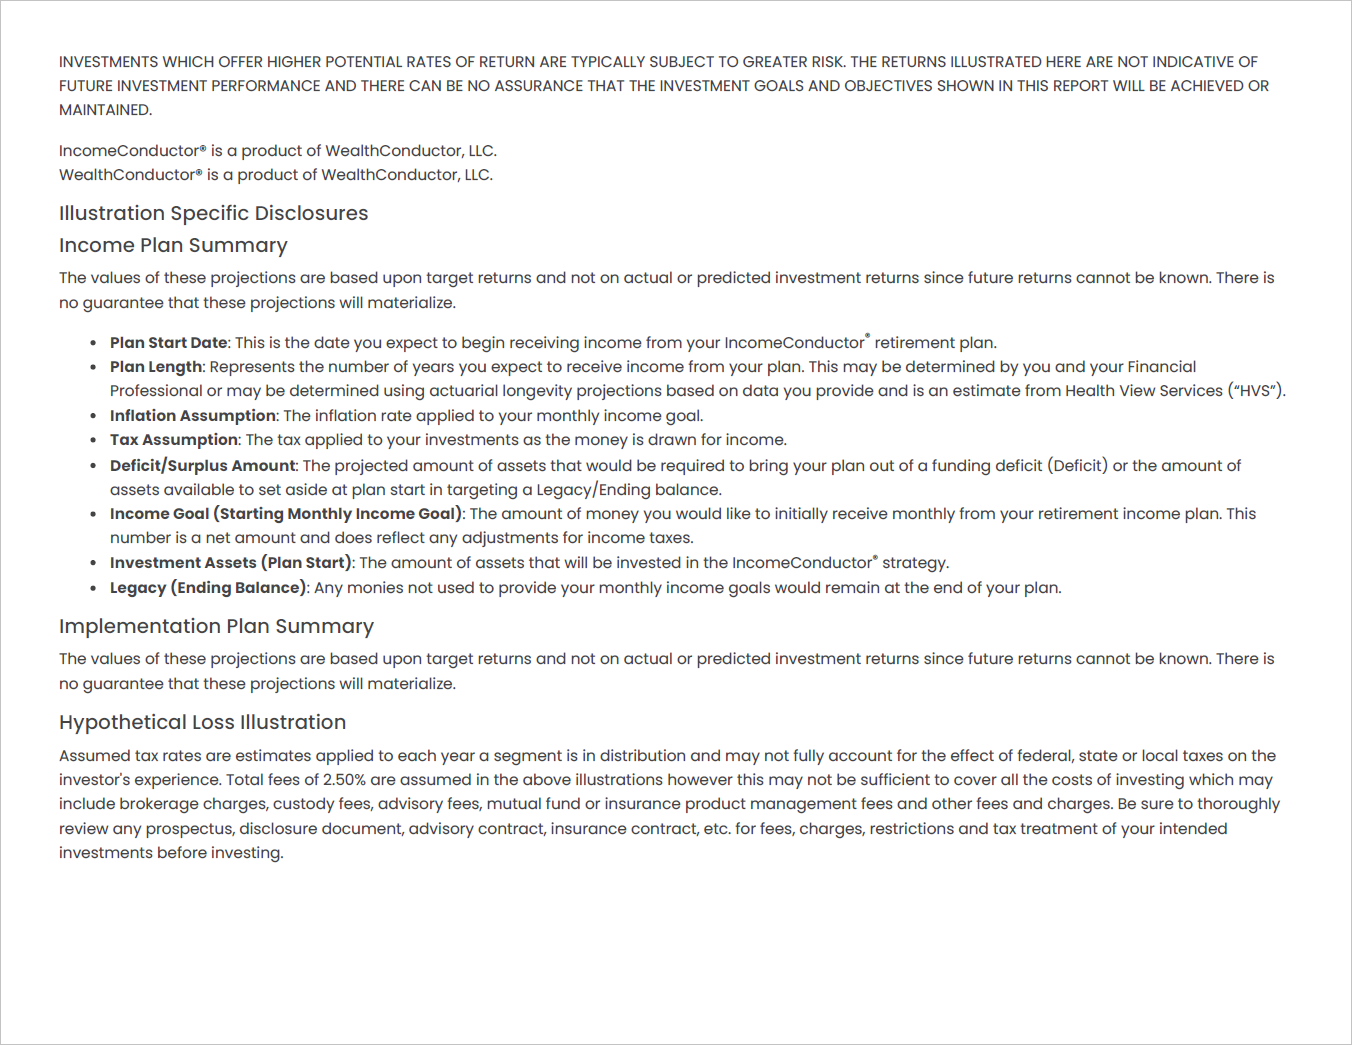
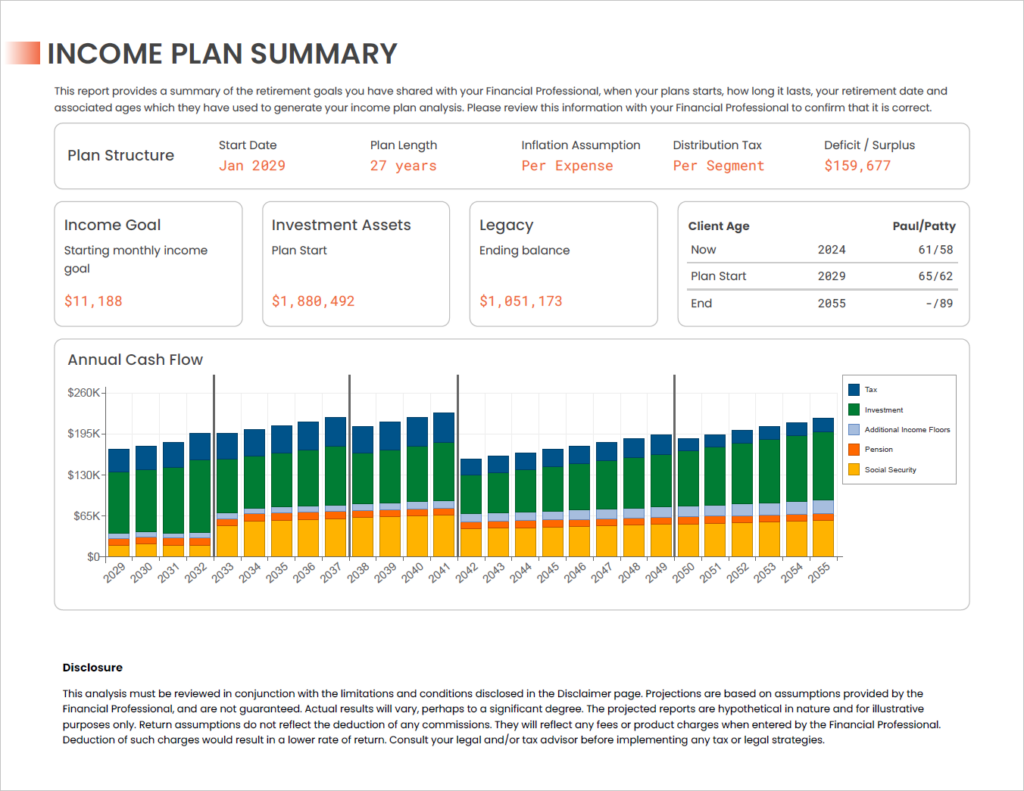
Income Plan Summary
This module provides a summary of the retirement goals as provided by your client, when the plans starts, how long it lasts, assumed retirement date(s) and associated age(s) which have been used to generate the income plan analysis.
Implementation Plan Summary
This report provides a summary of the segment structure of the income plan, including the amount of assets required to allocate to each segment to fund them, the duration over which they are designed to provide income, and the projected income levels at the start of each segment.

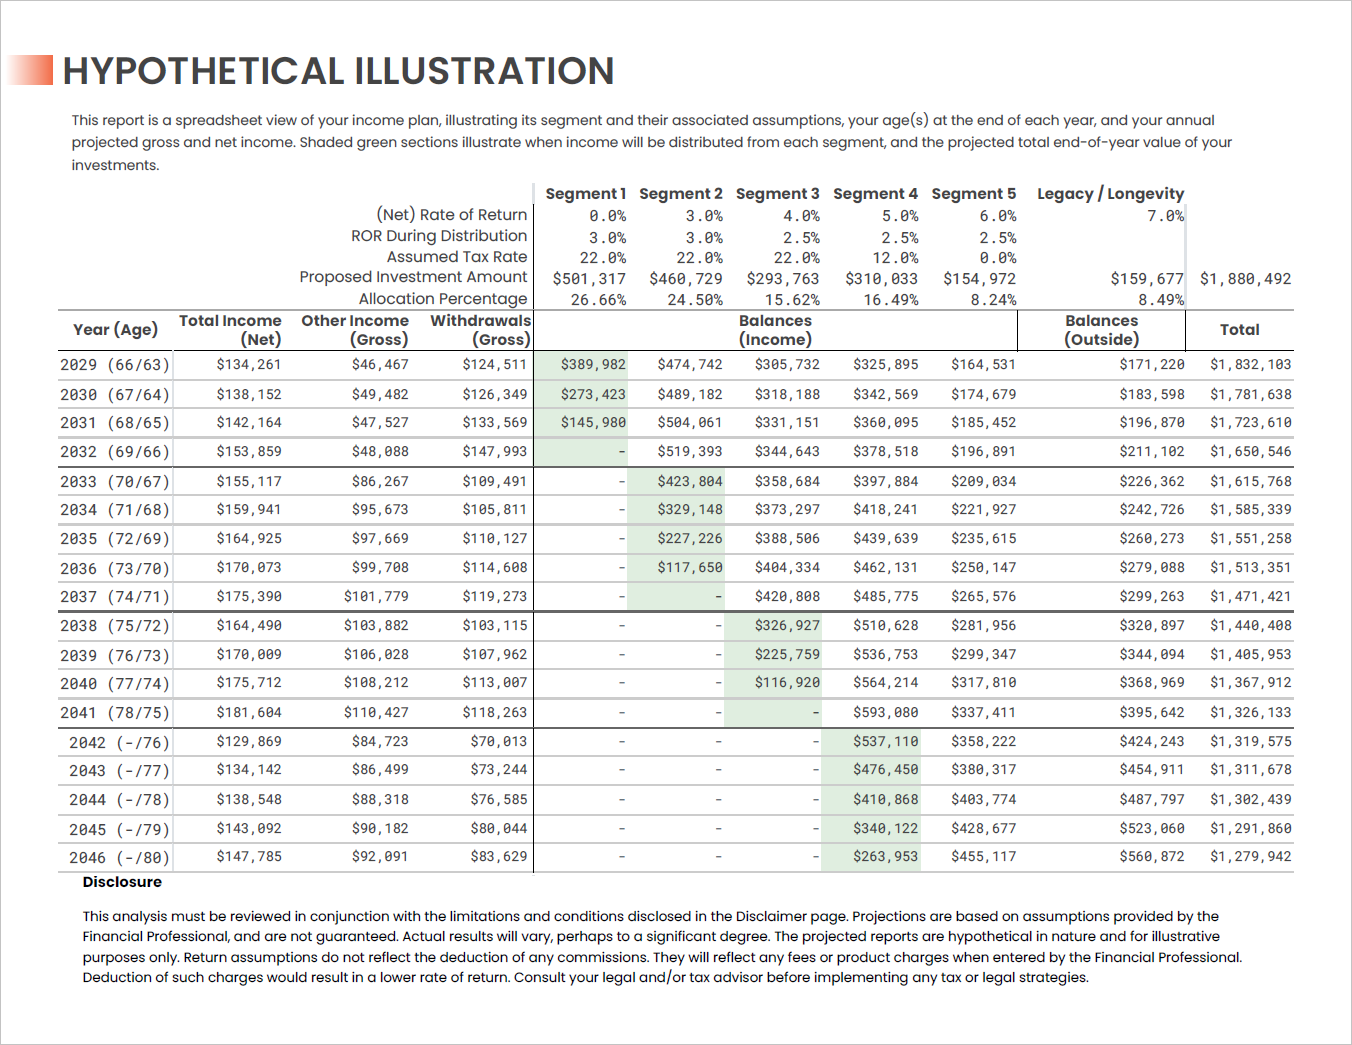
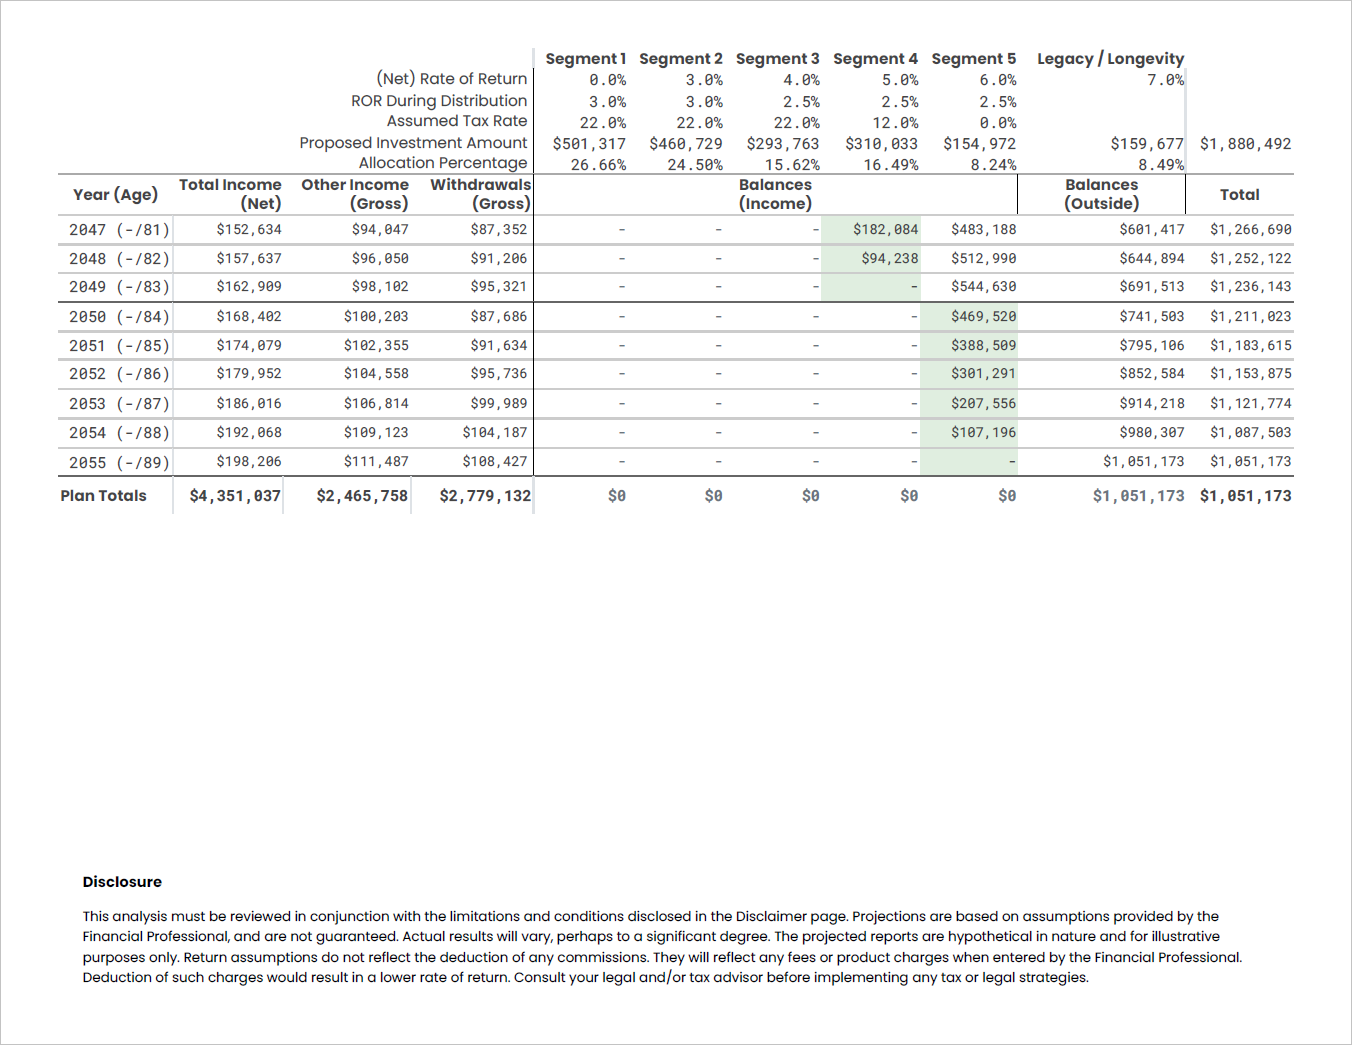
Hypothetical Illustration
This illustration shows a consolidated view of all plan information.
- Plan calendar years with projected client ages at year-end
- Segment assumptions including Net Rate of Return, Distribution ROR, Assumed Tax Rate, Proposed Investment Amount, and Allocation %
- Net-of-taxes monthly income total by year, as well as total annual Other Income (gross of taxes), and total annual Withdrawals (gross of taxes)
- Projected segment balances at year-end for each plan year, with distribution years highlighted in green.
- Total projected plan balance by year
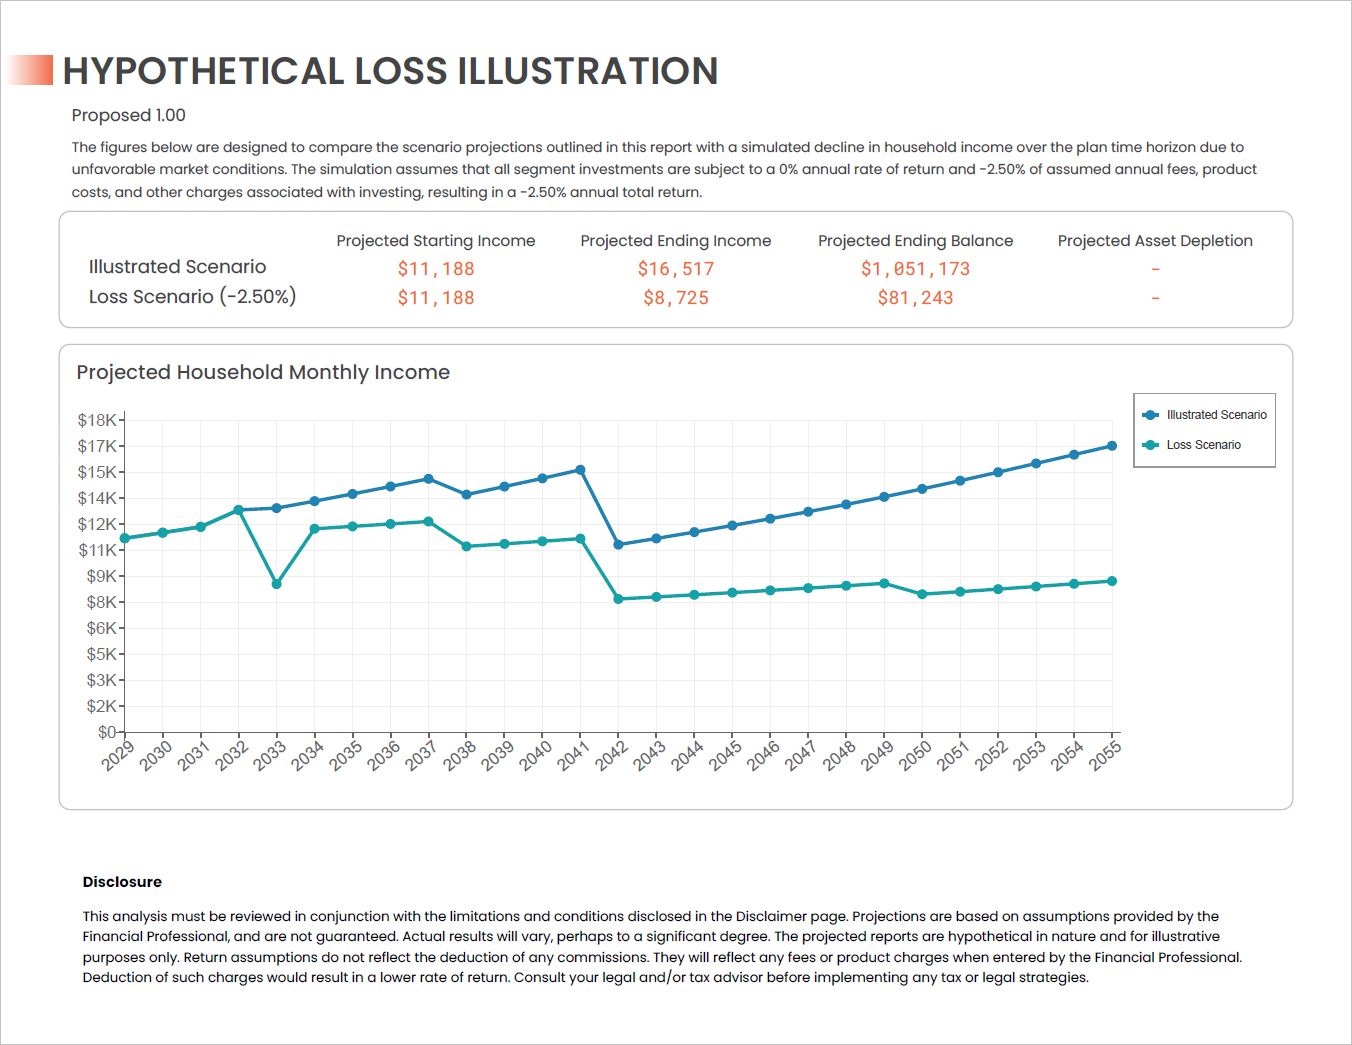
Hypothetical Illustration – 2.5% Loss
The figures in this module are designed to compare the scenario projections outlined in the report with a simulated decline in household income over the plan time horizon due to unfavorable market conditions.
The simulation assumes that all segment investments are subject to a 0% annual rate of return and -2.50% of assumed annual fees, product costs, and other charges associated with investing, resulting in a -2.50% annual total return.
The available income in each segment declines in a way to try and avoid segment depletion before its intended distribution period has ended.
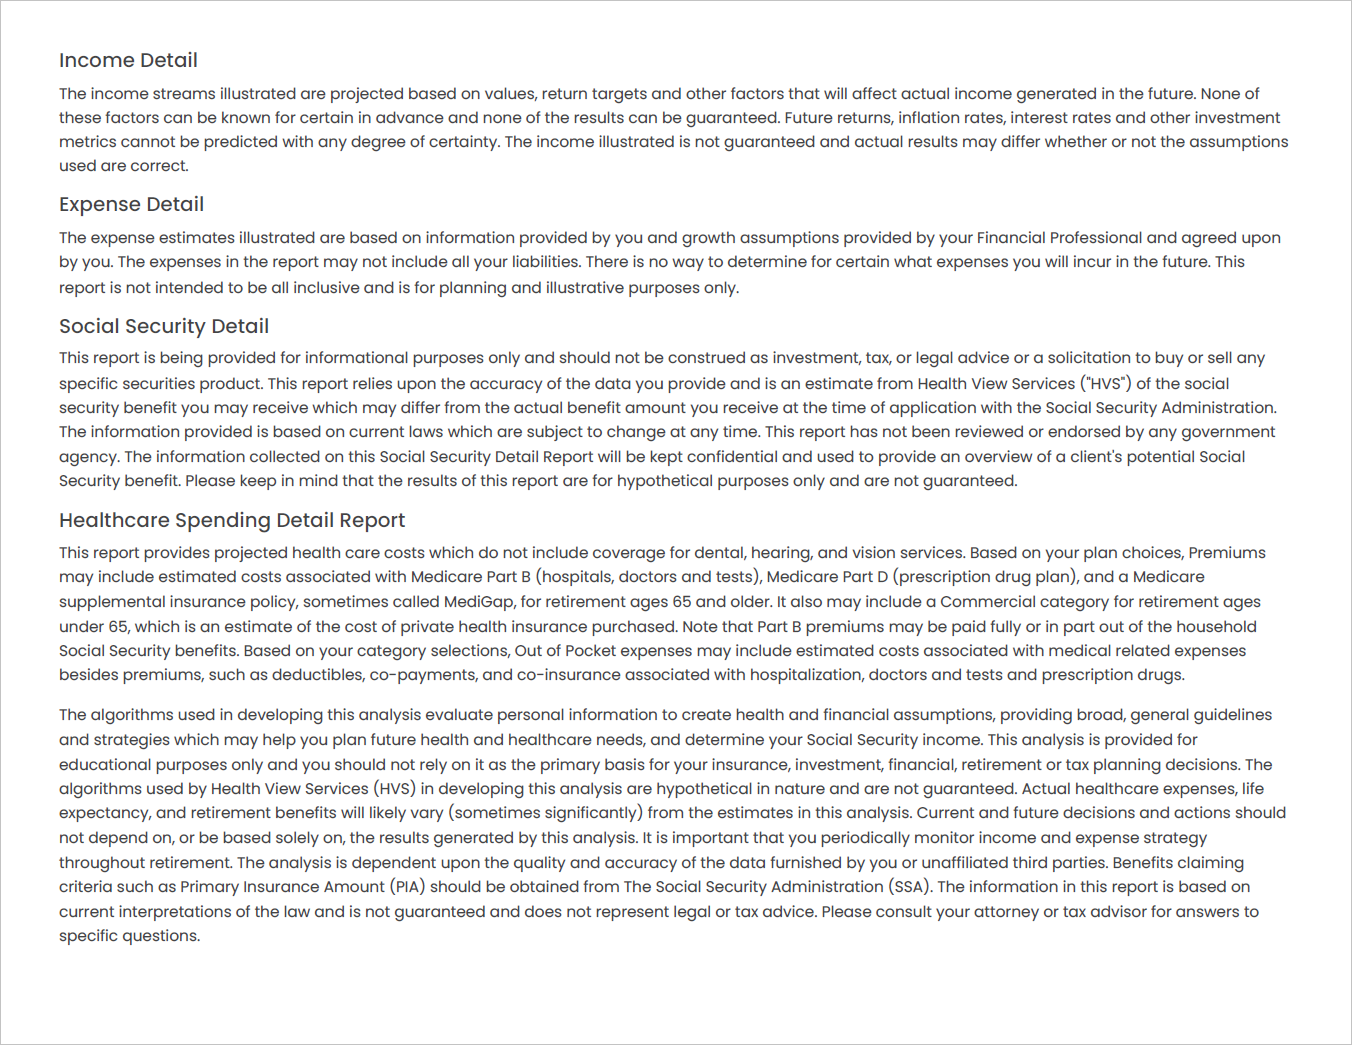
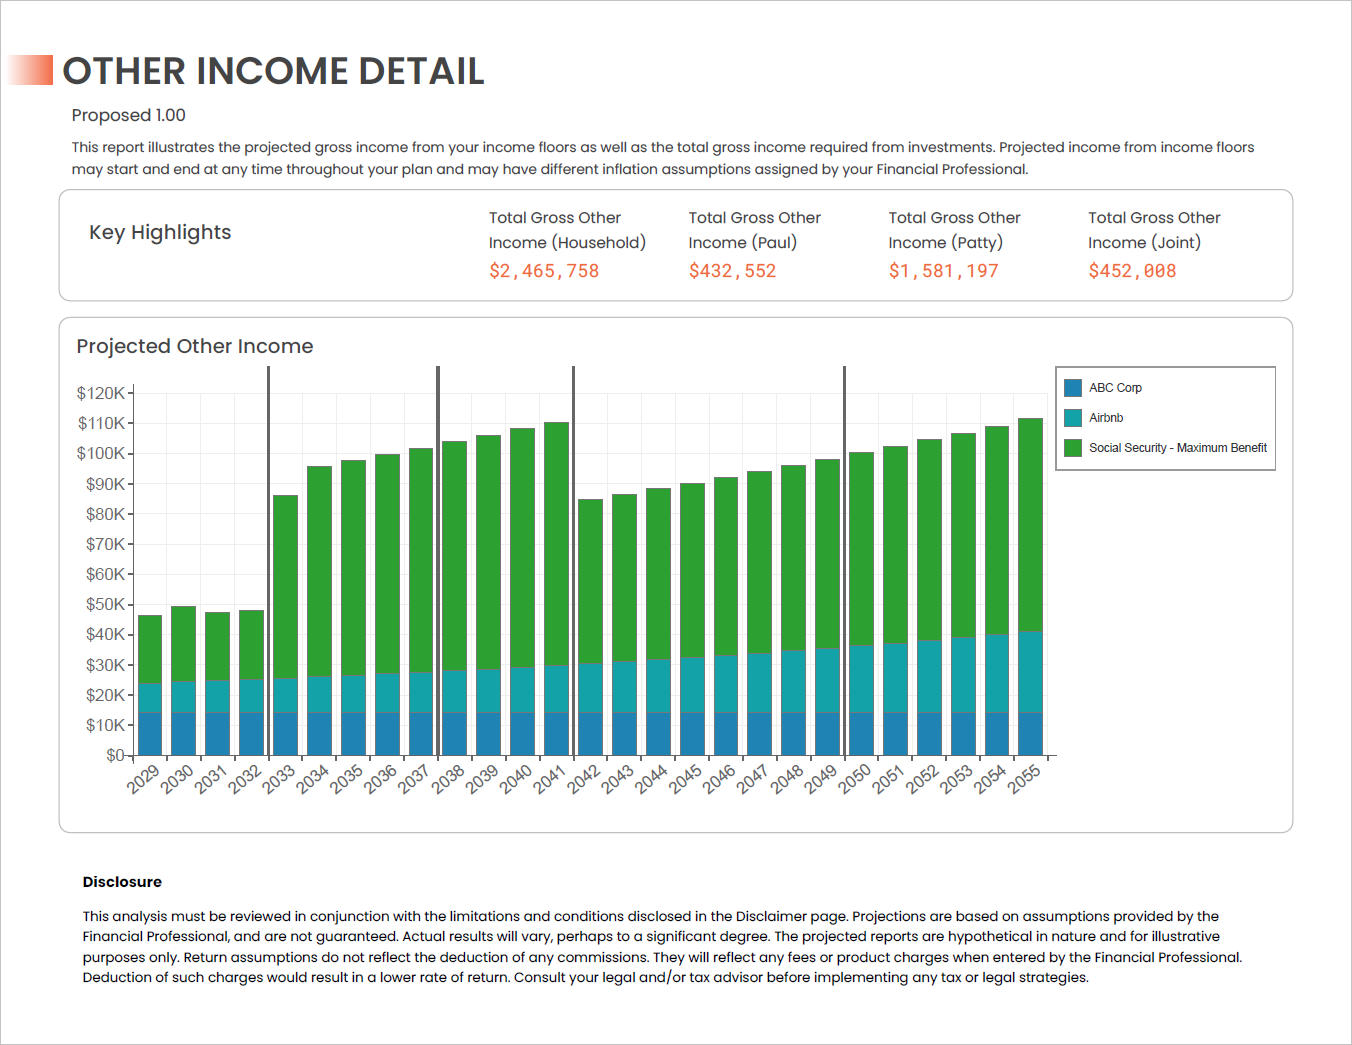
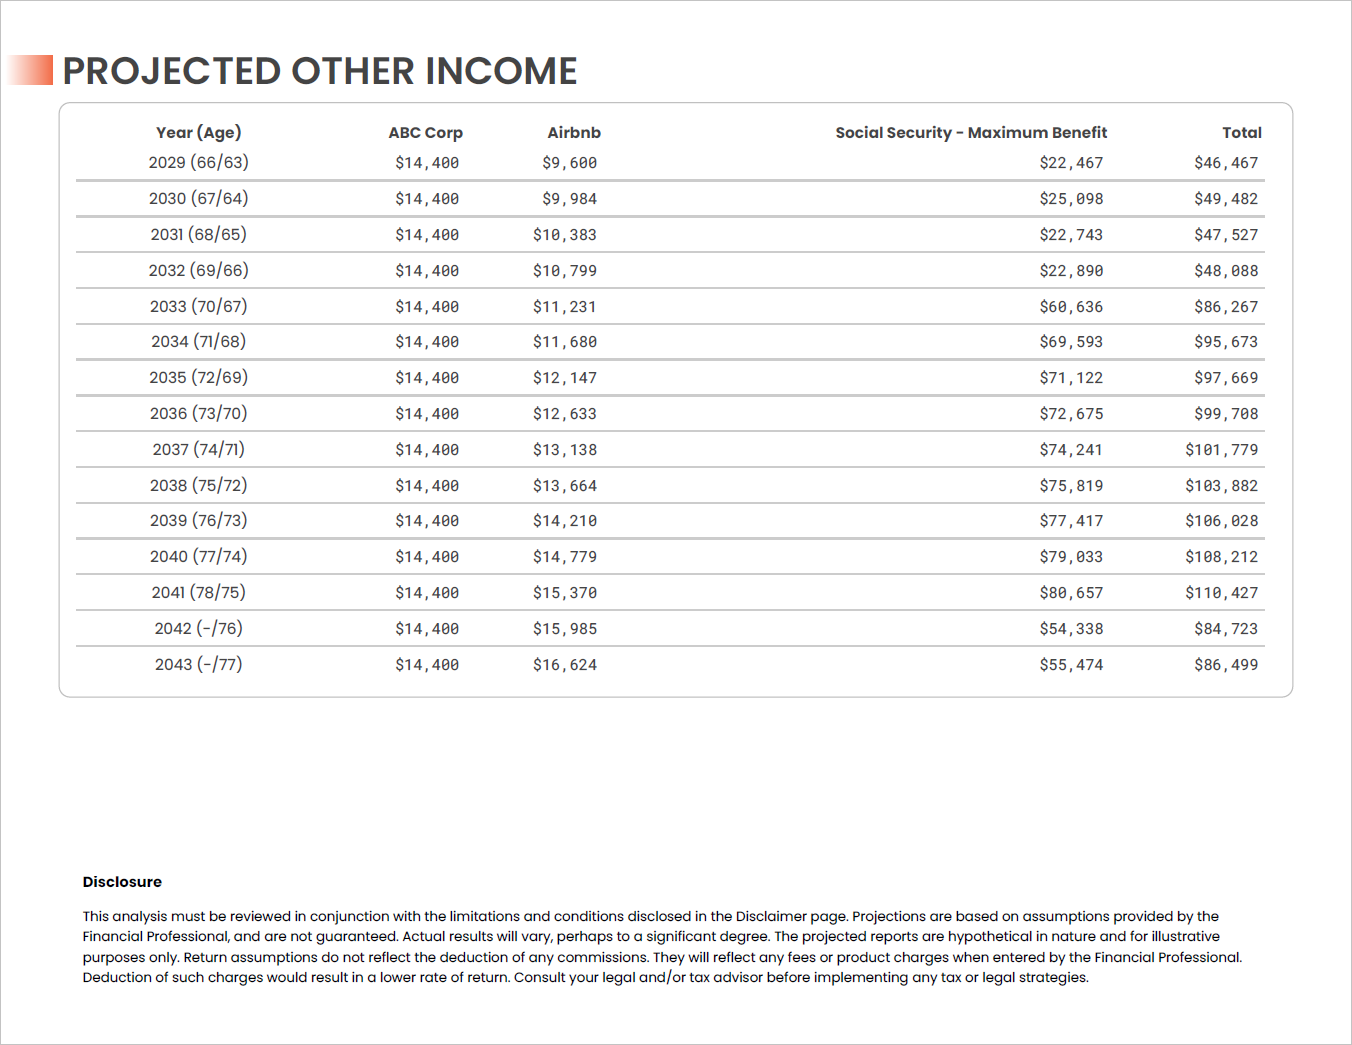
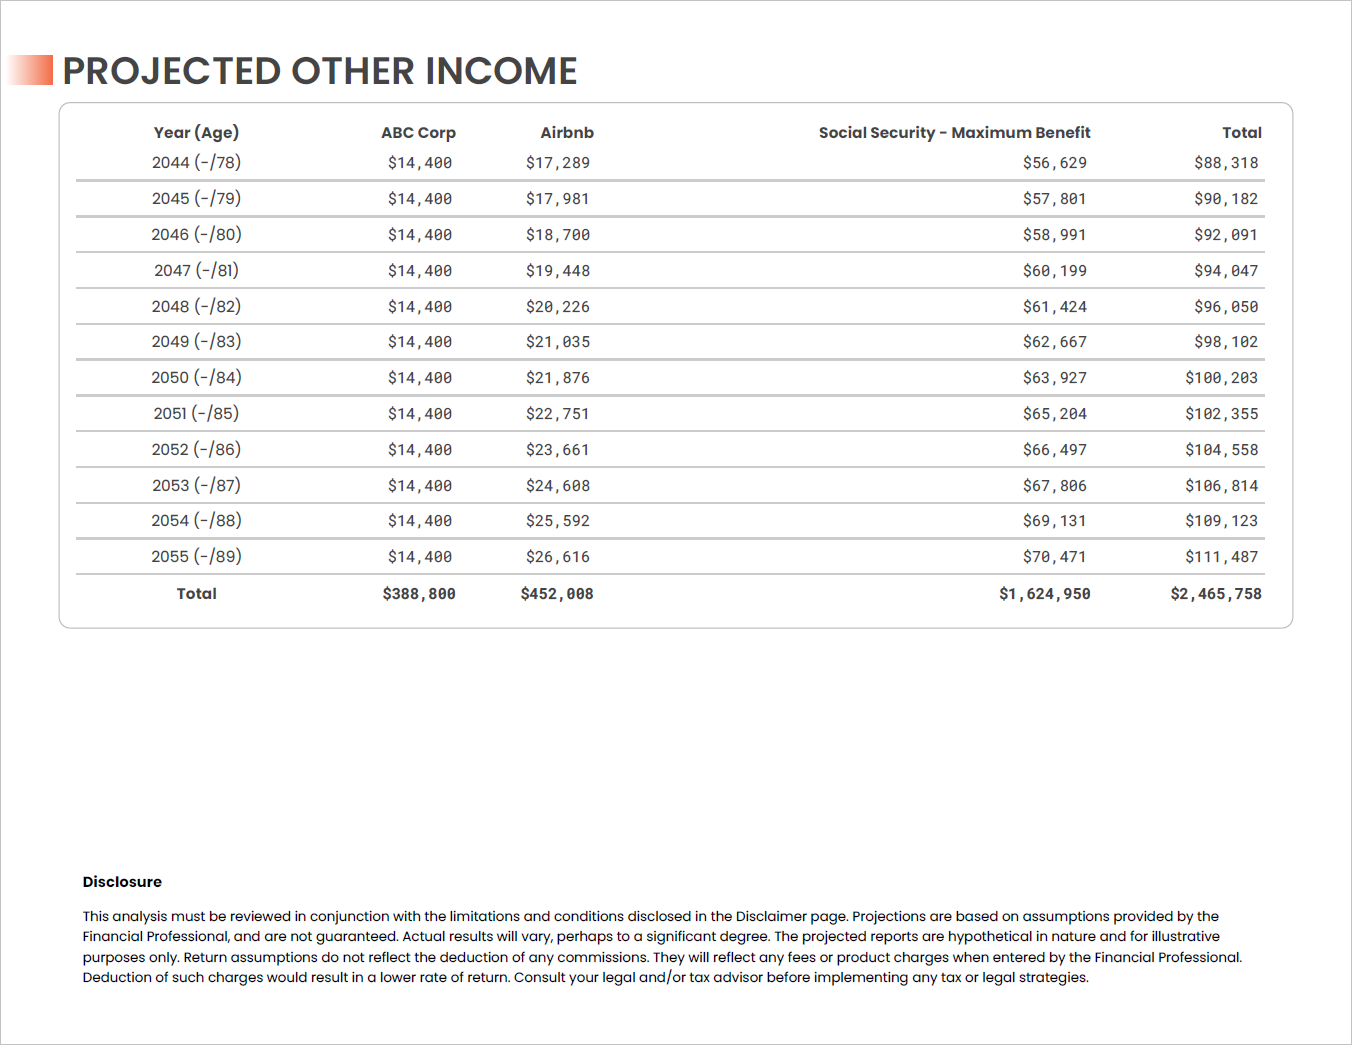
Other Income Detail
If Income Floors are incorporated into the plan, details on the cash flow generated by each is shown here with Key Highlight summary figures. A chart and tabular version of the data is provided. All figures on these pages are gross, or pre-tax. If no floors are specified, these pages will not appear in the report.
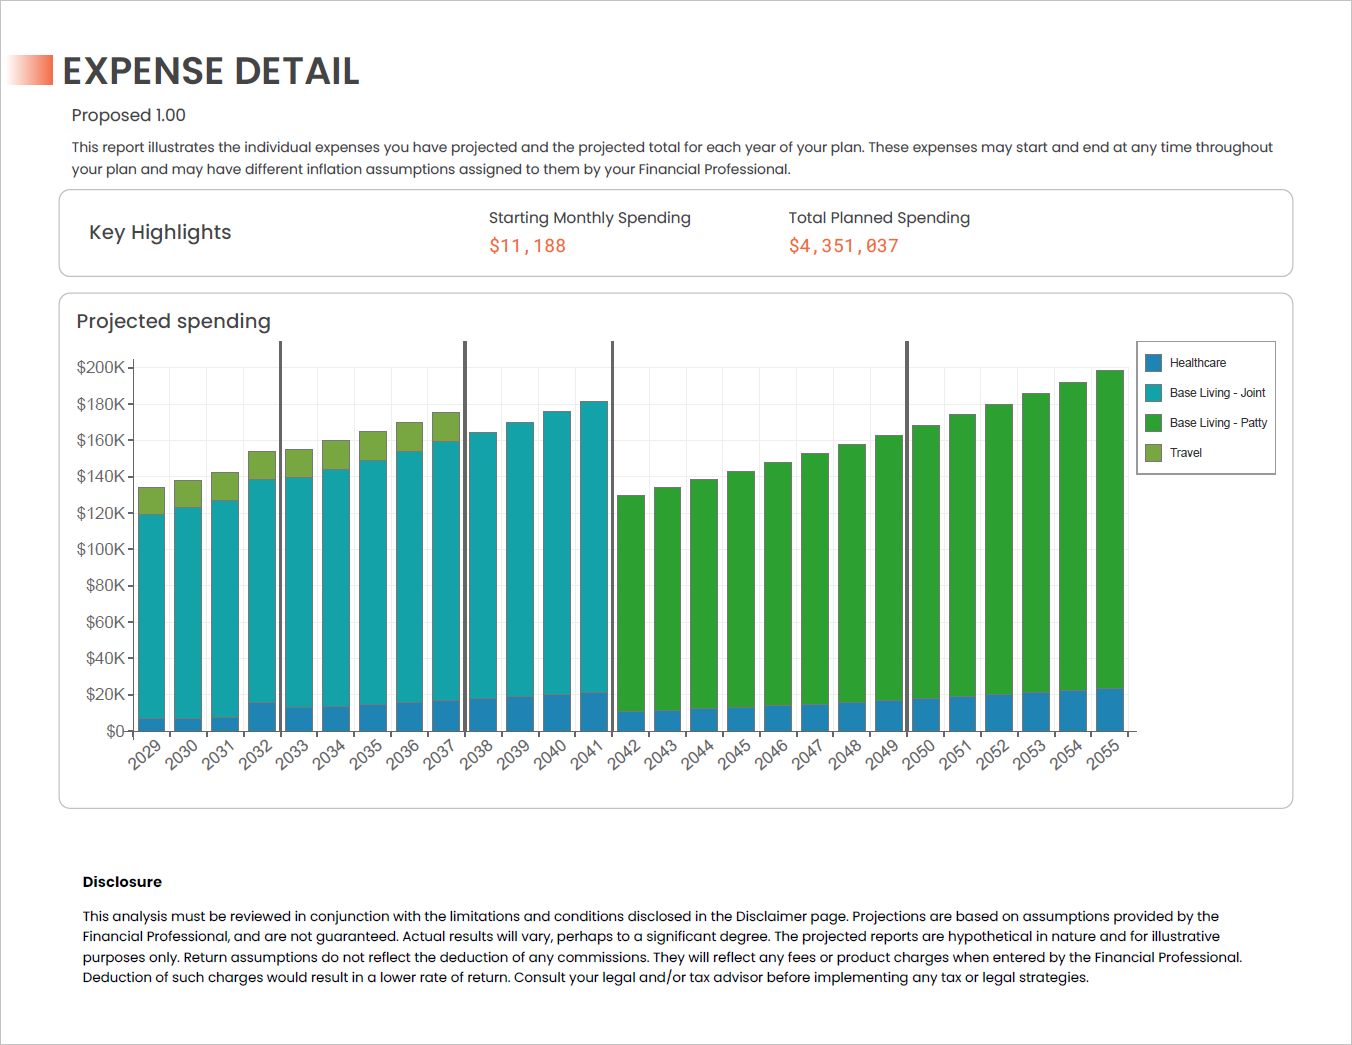
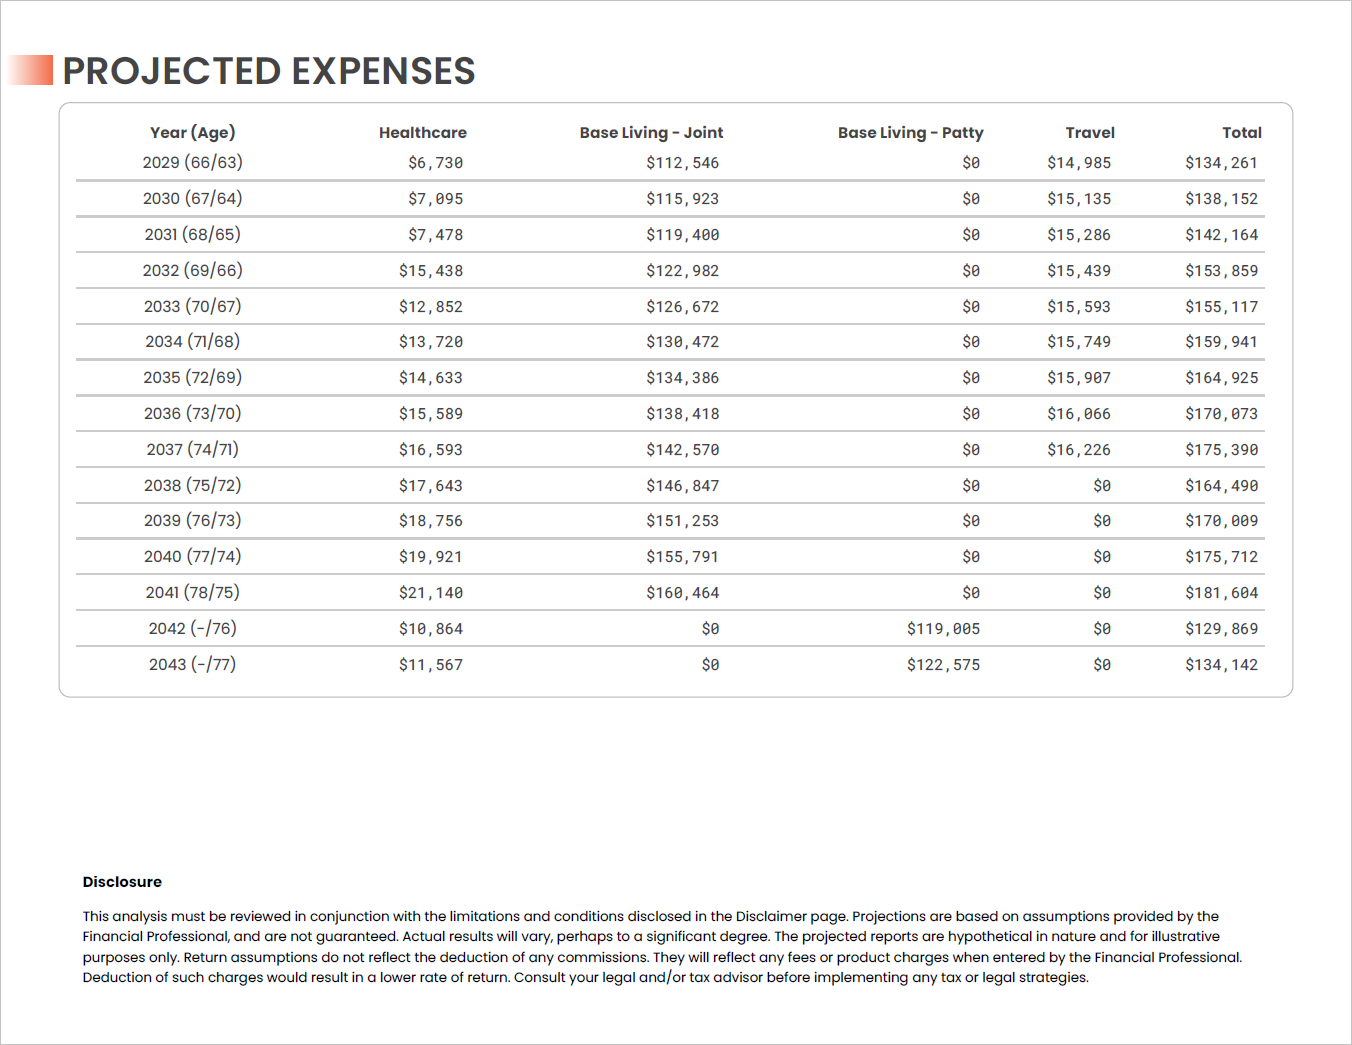
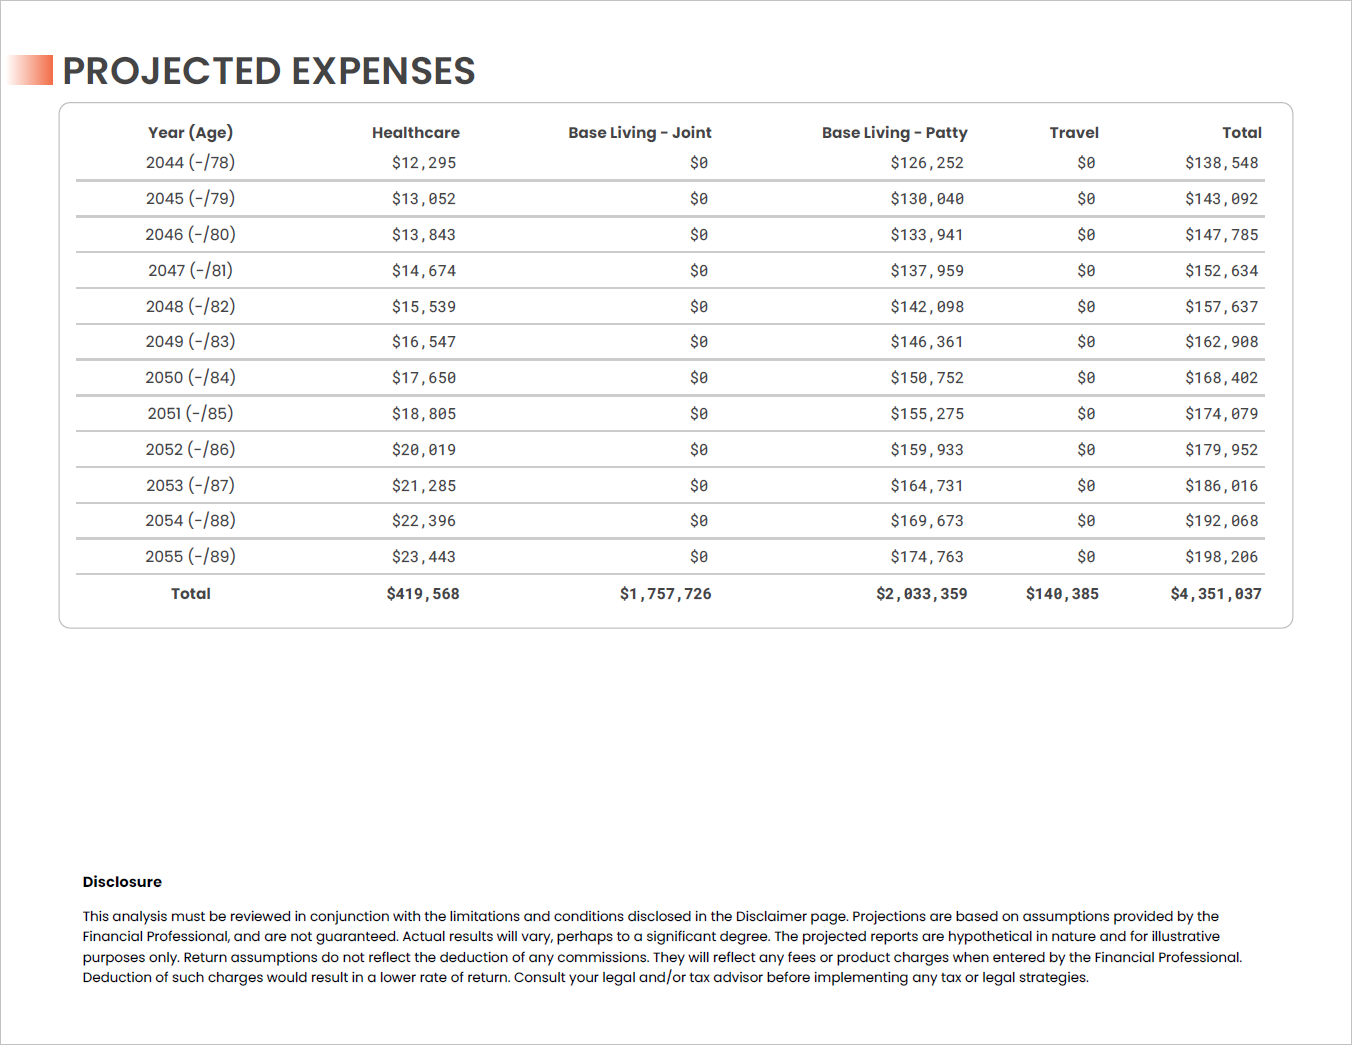
Expense Detail
If inflation for the plan is set to Expense-Level, all expenses will be shown with Key Highlight summary figures. A chart and tabular version of the data is provided. If either Plan-Level or Segment-Level inflation is used, these pages will not appear in the report.
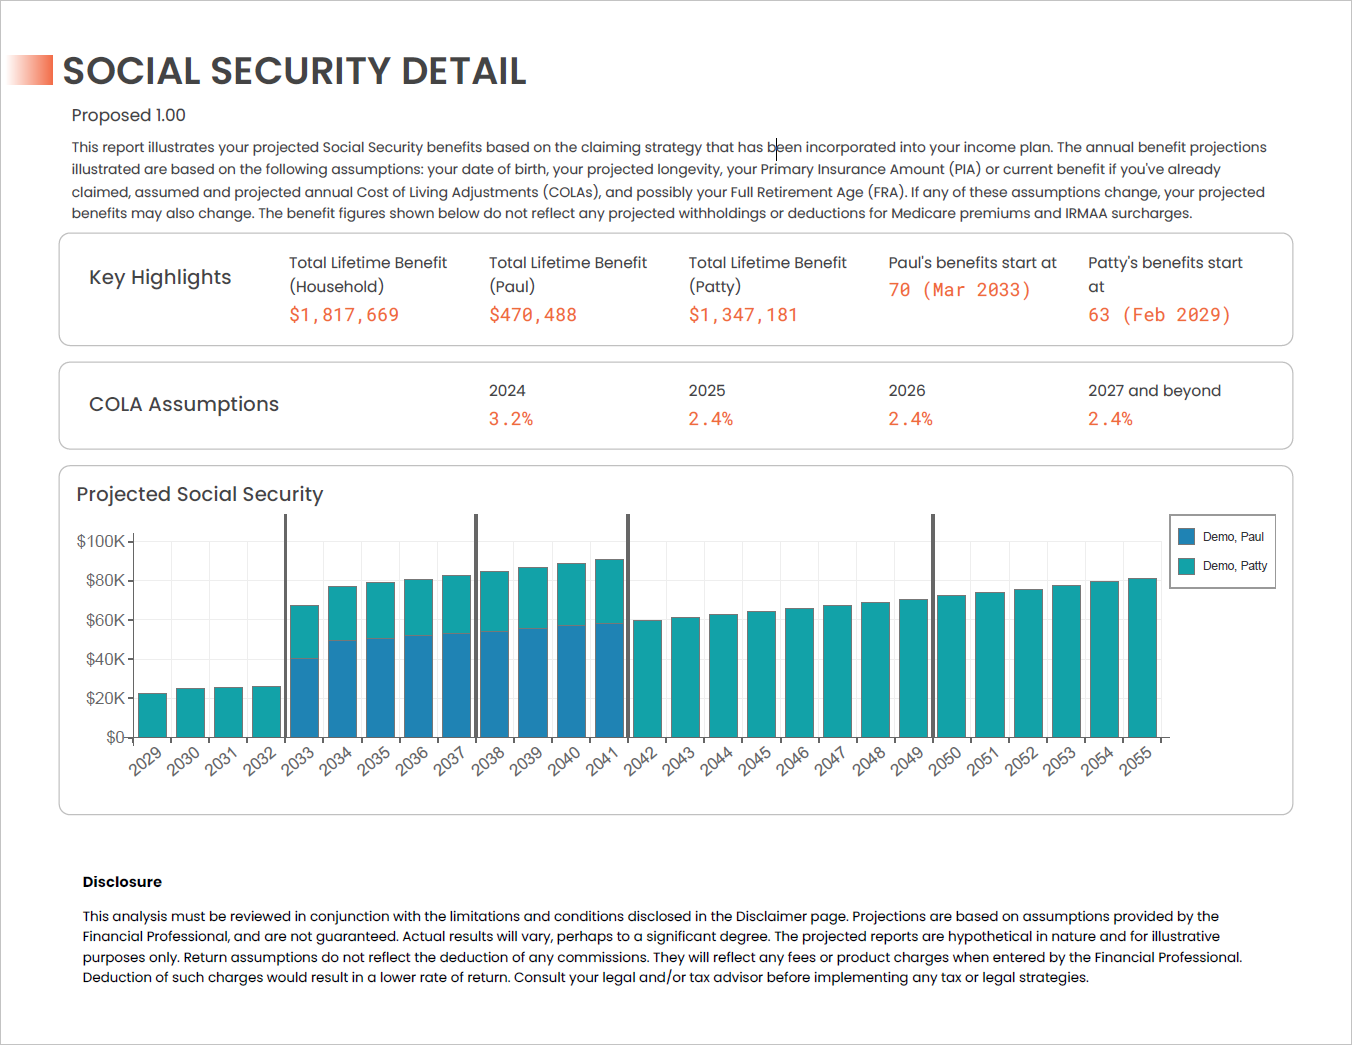
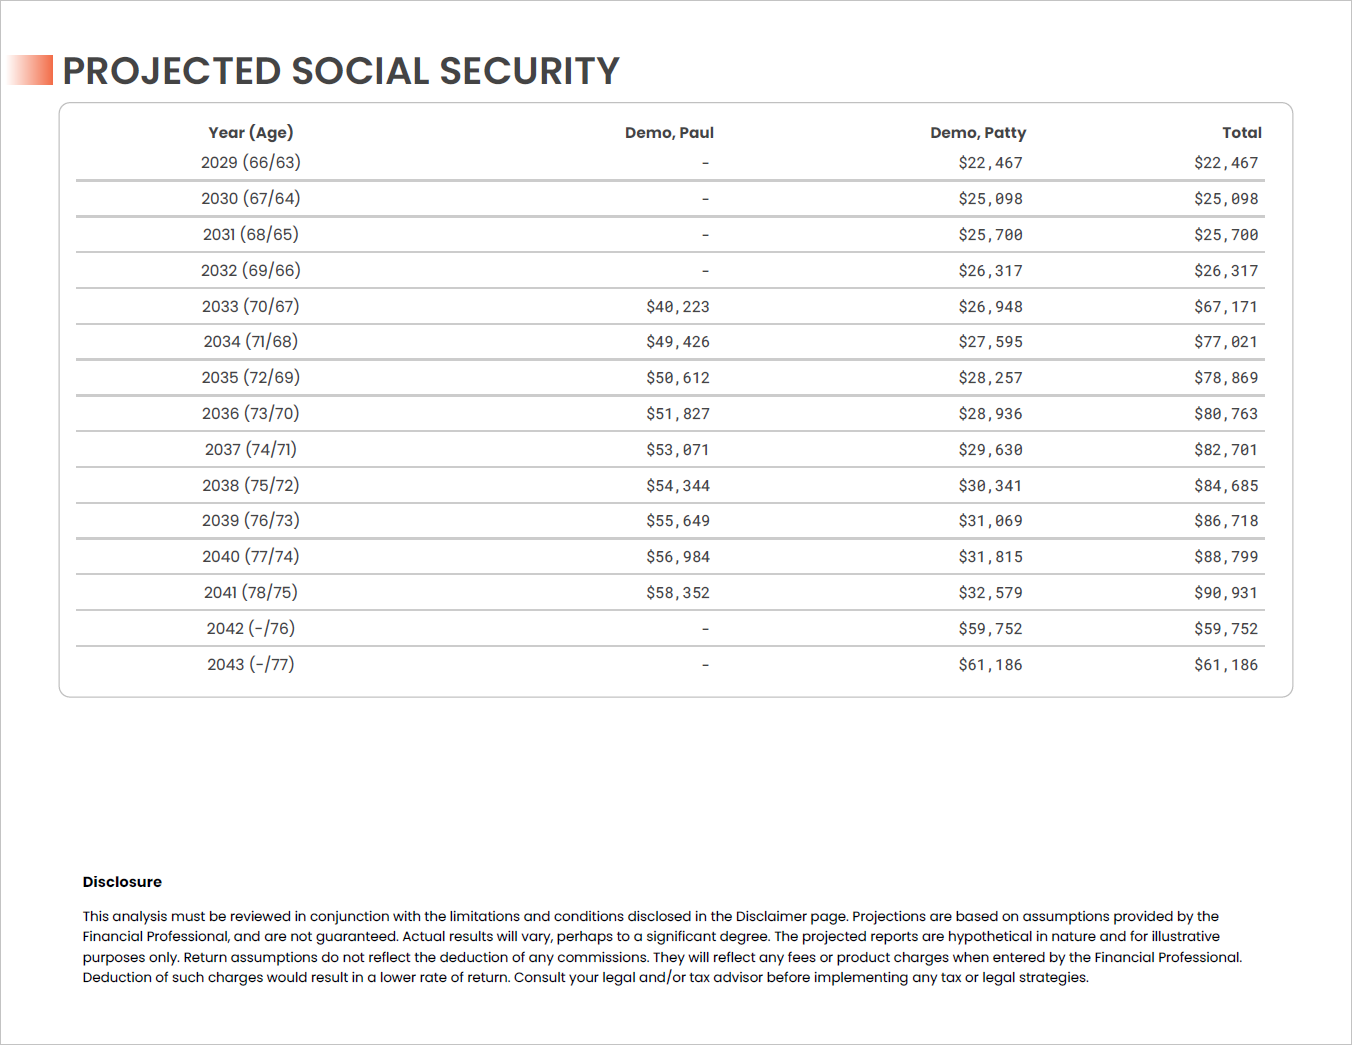
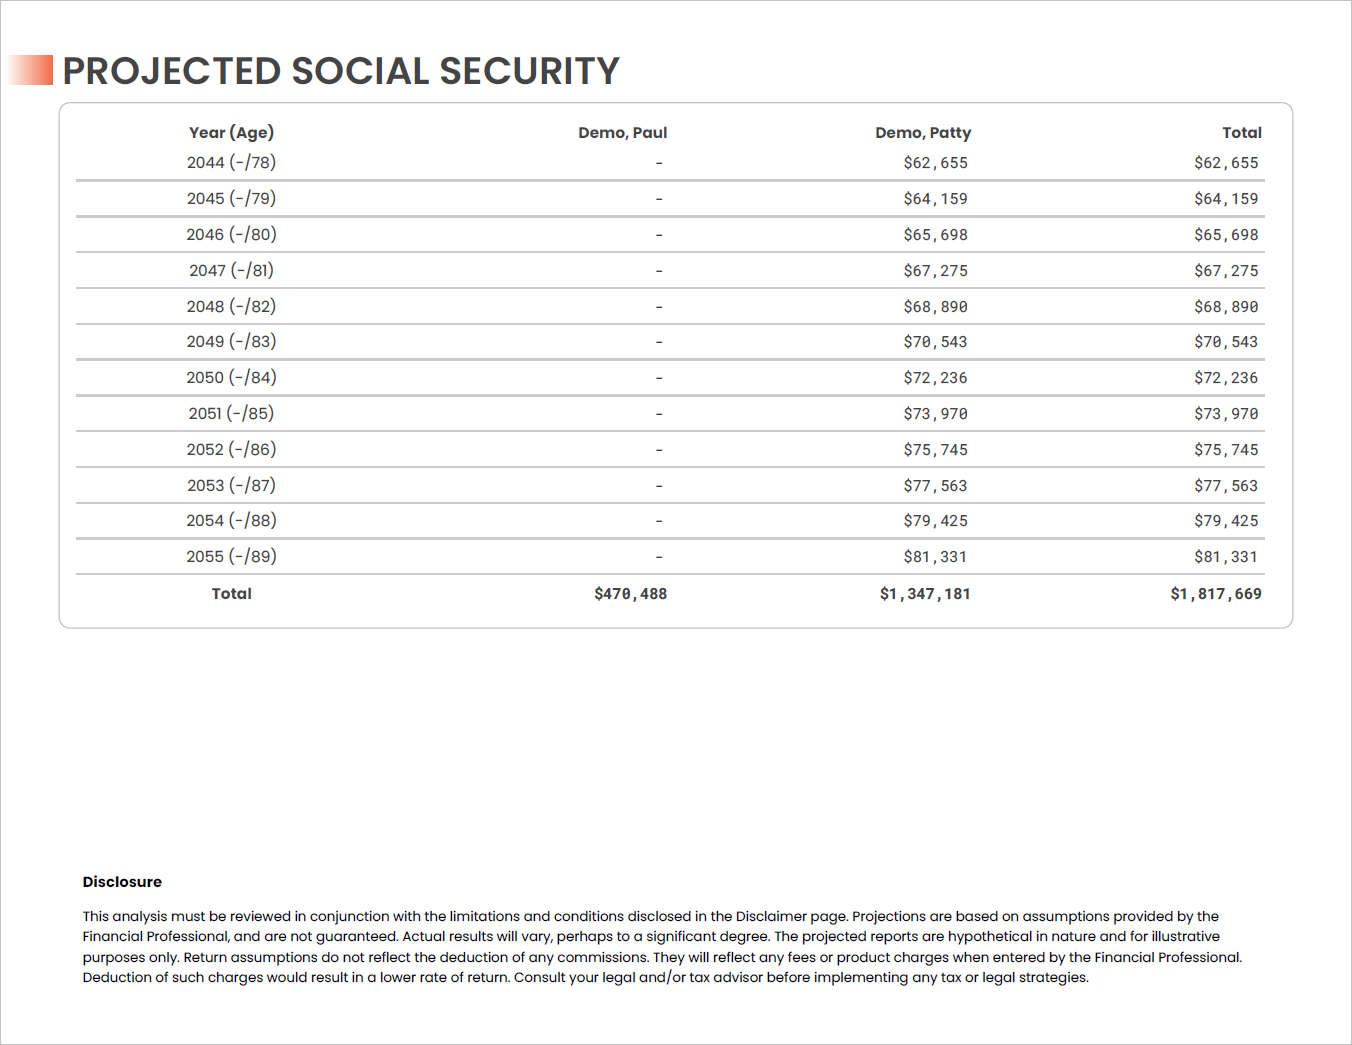
Social Security Detail
This report illustrates the household’s projected Social Security benefits based on the claiming strategy that was selected. The annual benefit projections illustrated are based on the following assumptions: client date of birth, projected longevity, Primary Insurance Amount (PIA) or current benefit a client has already claimed, and projected annual Cost of Living Adjustments (COLAs). The benefit figures shown below do not reflect any projected withholdings or deductions for Medicare premiums and IRMAA surcharges.
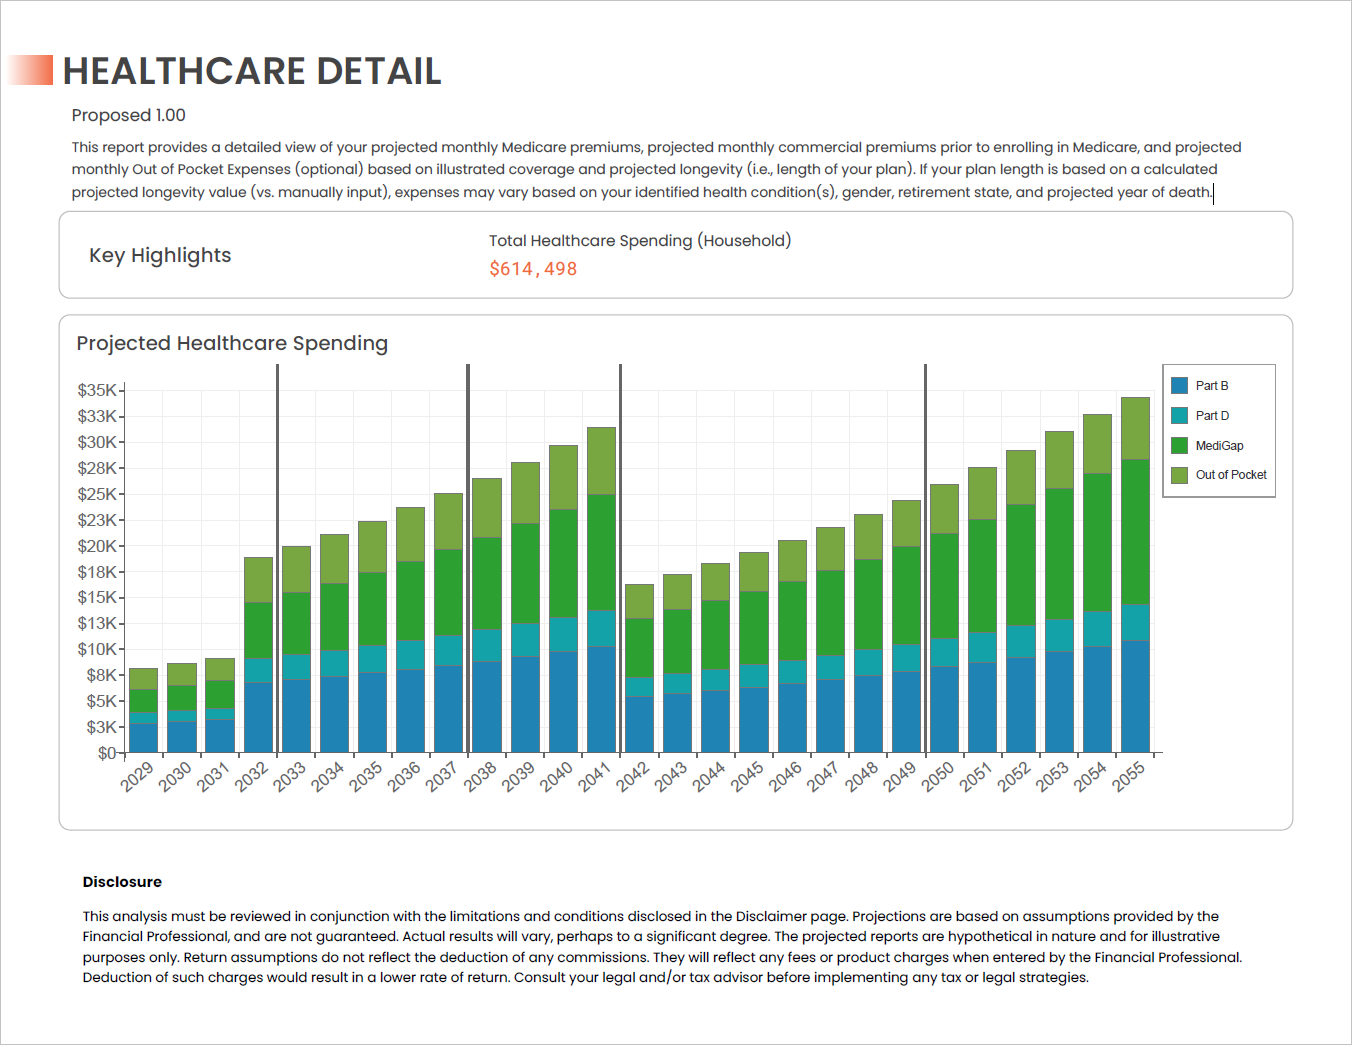
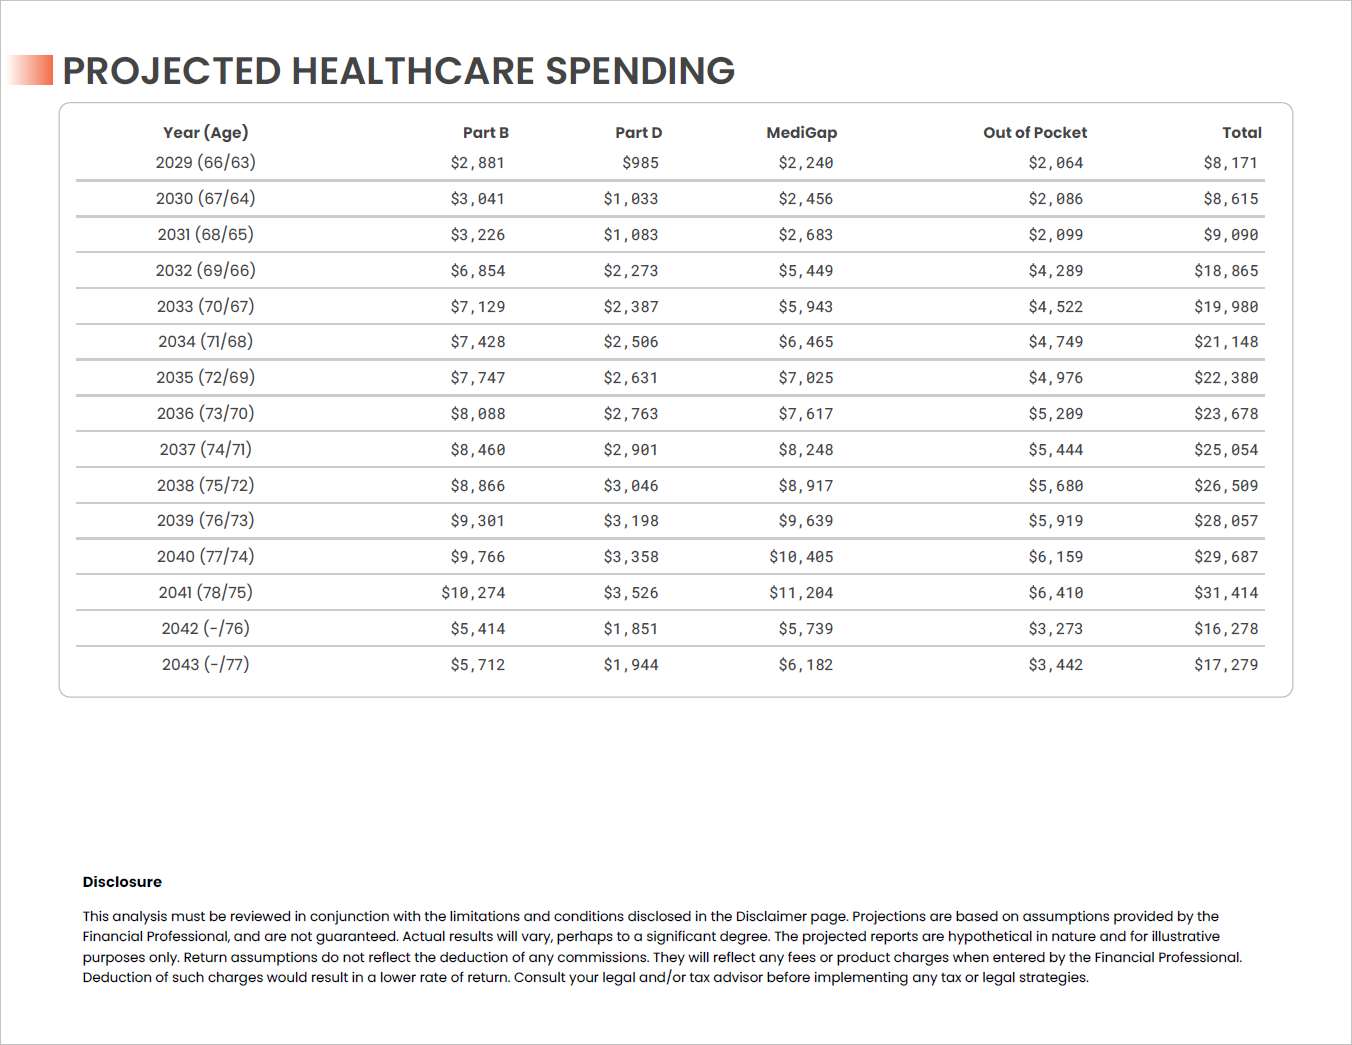
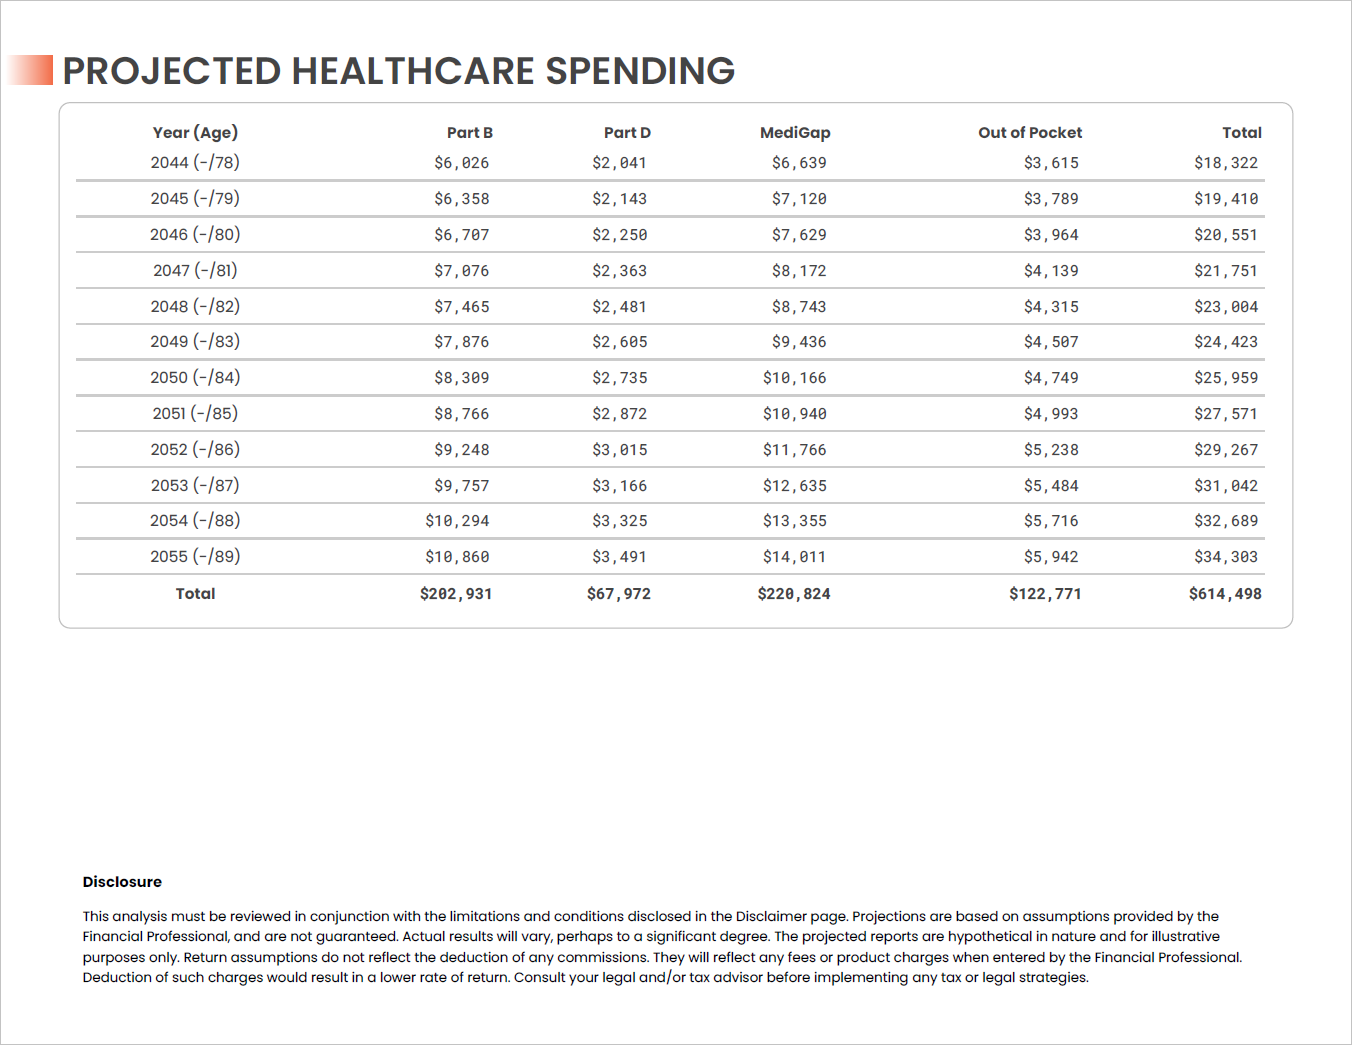
Healthcare Detail
This report provides a detailed view of projected monthly Medicare premiums, projected monthly commercial premiums prior to enrolling in Medicare, and projected
monthly Out of Pocket Expenses (optional) based on illustrated coverage and projected client longevity.
If the plan length is based on a calculated projected longevity value (vs. manually input), expenses may vary based on the clients’ identified health condition(s), gender, retirement state, and projected year of death.
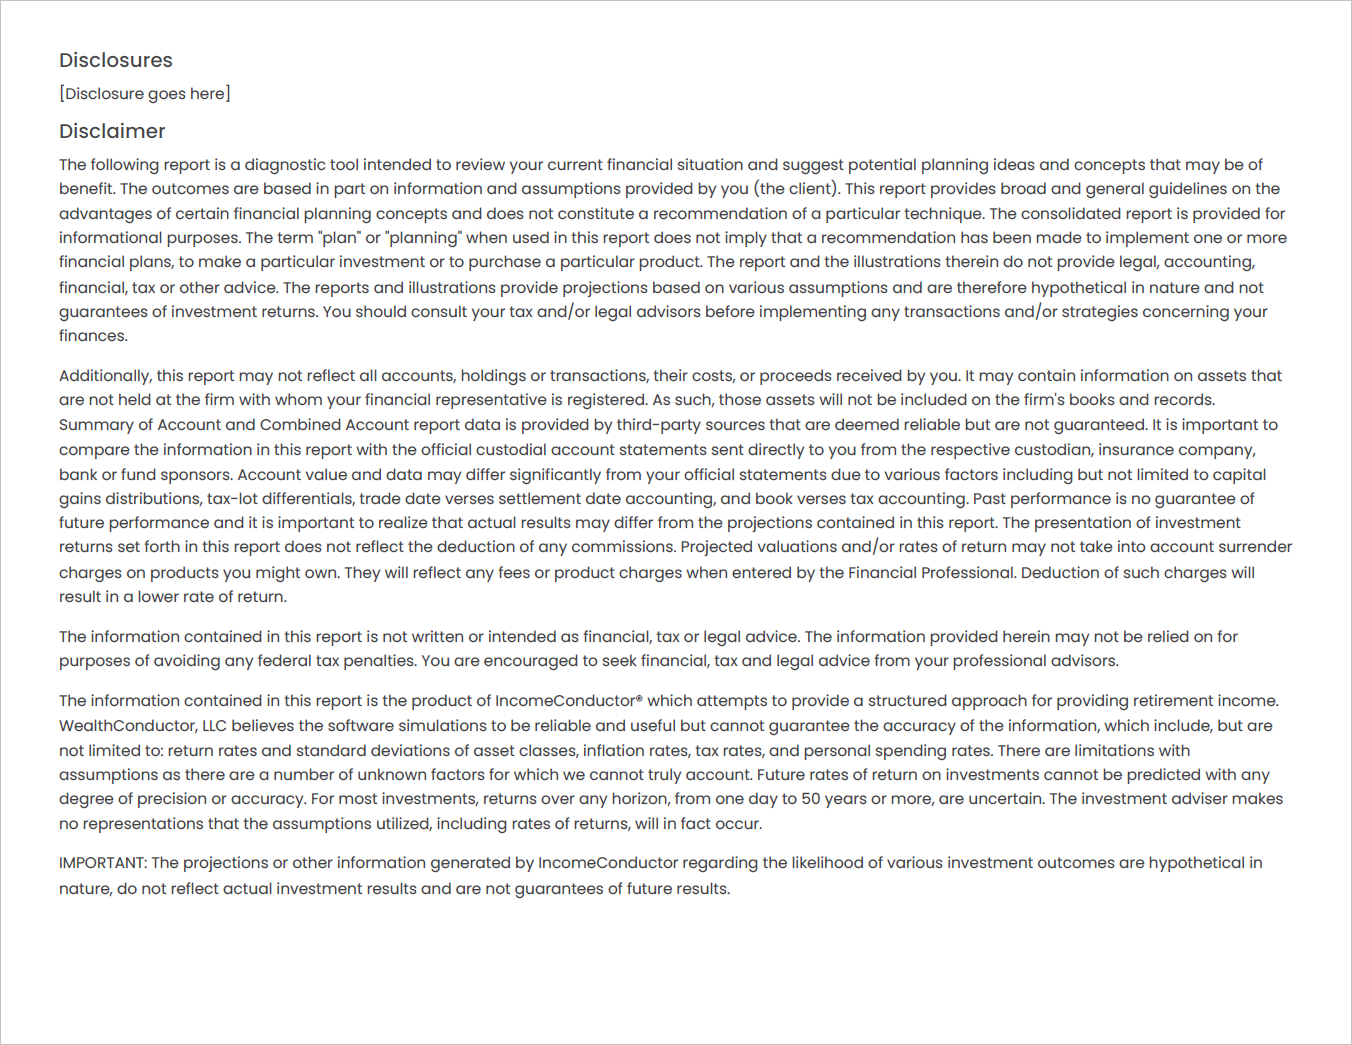
Disclosures and Disclaimers
The final pages of the Proposal include the disclosure provided to us when you subscribed, standard disclosures for WealthConductor LLC, as well as disclosures specific to the illustrations that appear in this report depending on the features utilized in the plan, such as expenses or income floors.