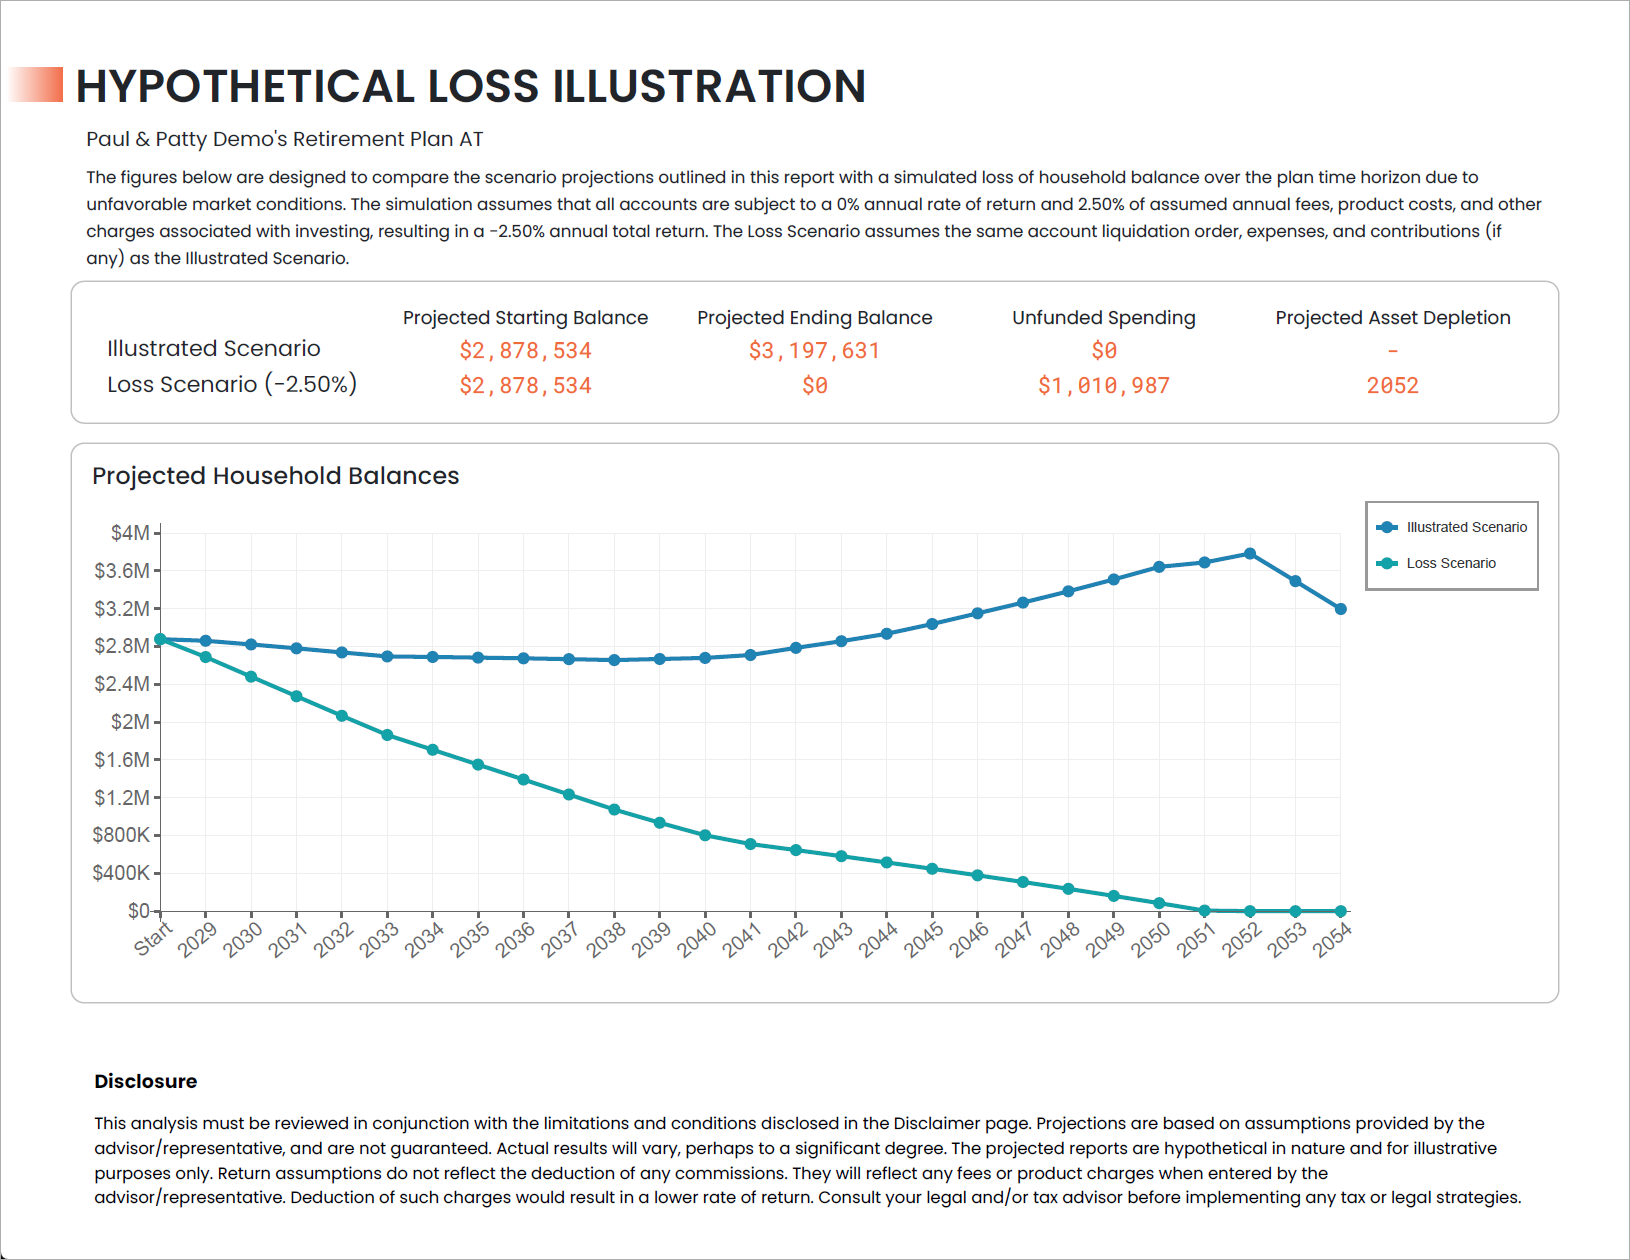
The Hypothetical Loss Illustration is a report module that shows projected annual household balance assuming that all accounts lose 2.50% in value every year.
The primary purpose of this illustration is to show the potential impact of investment risk over the duration of the plan assuming no modifications to the plan’s configuration are made at plan start.
Projected Starting Balance is the projected total asset value between accounts and annuity cash values as of the plan start date.
Projected Ending Balance is the projected total asset value between accounts and annuity cash values as of the plan end date.
Unfunded Spending is the projected total expenses that are unable to be covered due to a lack of assets available for withdrawal.
Projected Asset Depletion is the year in which either scenario is projected to deplete the value of all accounts included in the plan.

The Illustrated Scenario represents the projected plan data as shown in all other modules of the report. The Loss Scenario represents a scenario that uses all of the same assets and assumptions, except all accounts incur a -2.50% return every year, regardless of whether they are in a segment’s growth or distribution phase
The specific calculation assumes a 0% investment return, and 2.50% of annual fees, which are withdrawn from the accounts on a monthly basis, at the end of the month. For non-qualified accounts, the cost basis reduces proportionately to the overall value of the account with each withdrawal.
If the decline in account value results in an account specified as a source account for a future annuity purchase to lack the necessary funds to complete the purchase, the purchase is not modeled as taking place and any resulting income stream that the annuity would have provided is not included in the loss scenario.
Scenarios may arise where there are annuities that retain a cash value at the end of the plan but account assets are fully depleted resulting in an >$0 Projected Ending Balance, but also >$0 Unfunded Spending.
Standard disclosures are provided in the footer, as well as additional disclosures specific to this illustration in the Disclosures section at the end of the report.
Jump to the next report module: